
YouTube Analytics
How Does My YouTube Channel Compare to Similar Channels in My Niche?
Updated October 5, 2026 · 12 min read
TL;DR
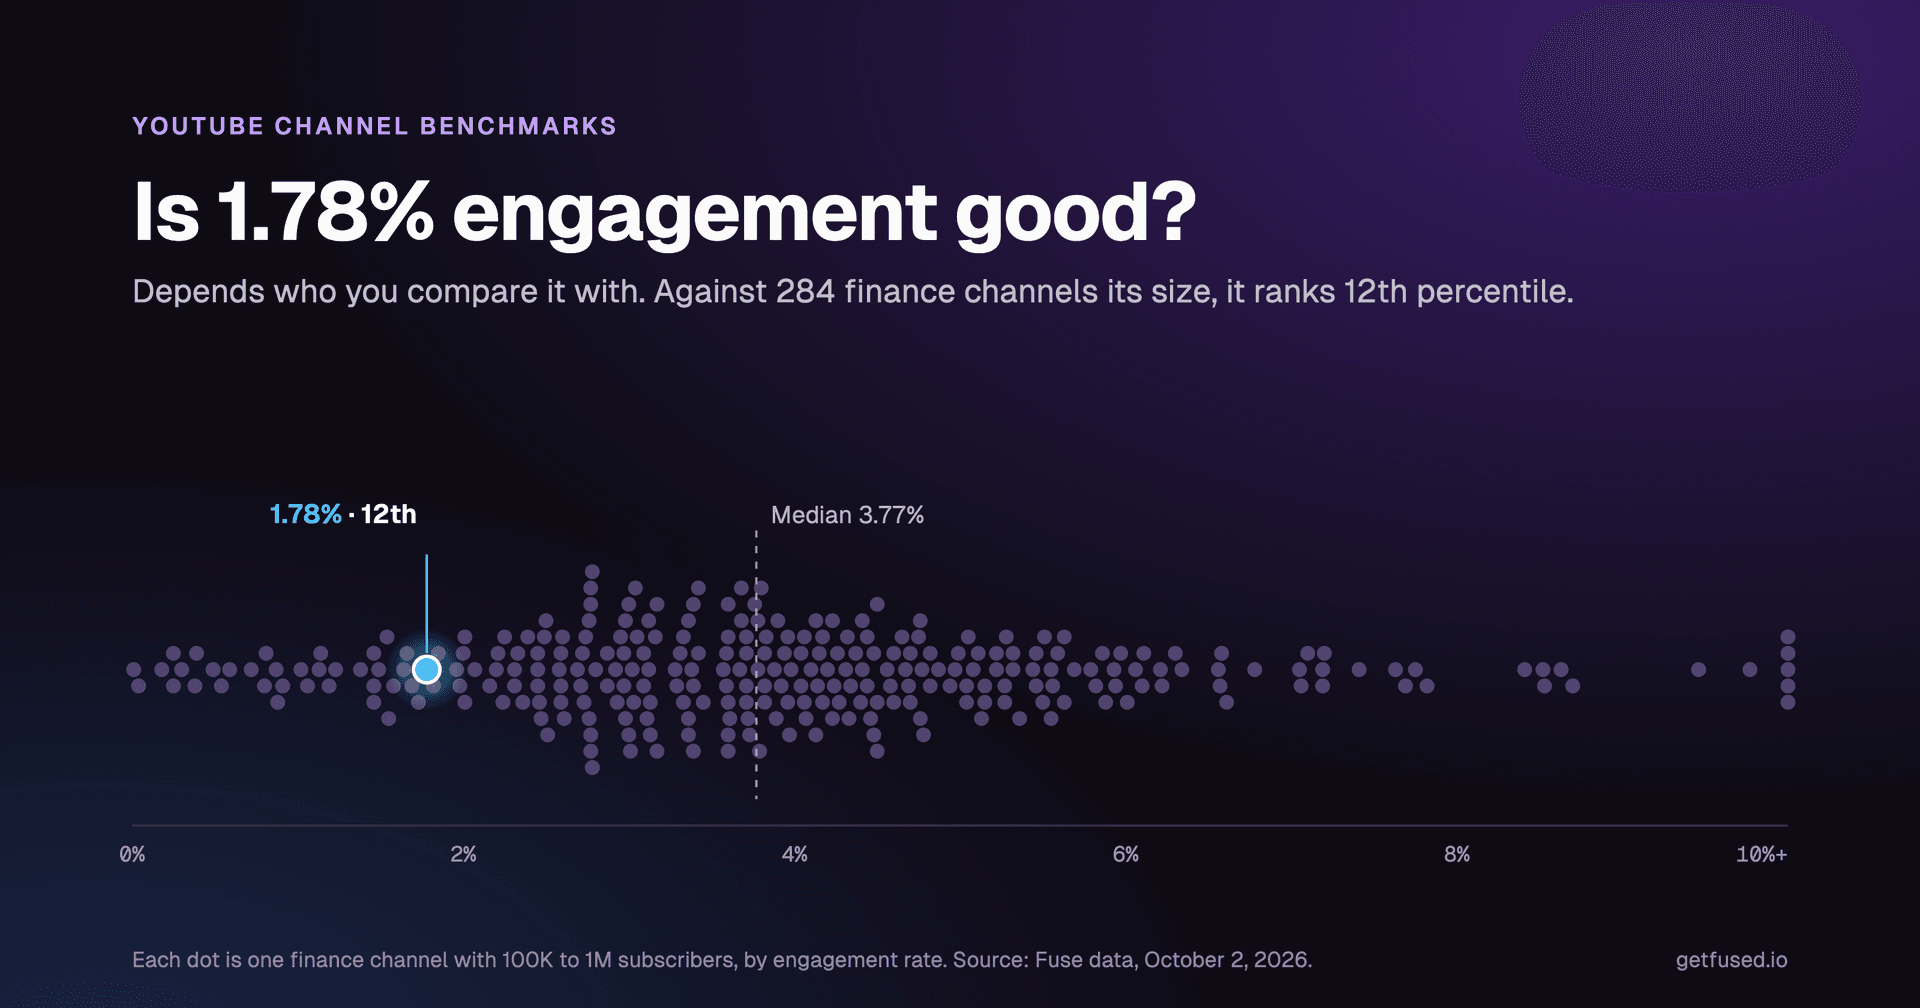
A fair YouTube benchmark compares your channel against peers in the same niche AND the same subscriber band. Finance channels at 100,000 to 1,000,000 subs have a median engagement rate of 3.77 percent, technology micro channels sit at 2.20 percent (Fuse data, October 2026). Compare on five metrics, not one, and read the percentile.
YouTube Studio reports a channel's numbers in isolation. Views, engagement rate, subscriber count, shown as absolute values with no peer comparison. It never says normal, strong, or weak for the niche and size. For that read you need a comparison, and the comparison has to be fair.
Benchmarking a channel is comparing its metrics against peers in the same niche and the same subscriber band, then reading the result as a percentile against that cohort, not a grade. As of October 2, 2026, Fuse's finance macro cohort (284 channels at 100,000 to 1,000,000 subs) has a median engagement rate of 3.77 percent (Fuse data, October 2026). Technology micro channels sit at 2.20 percent. Same metric, different cohort, different reading.
What does it mean to benchmark a YouTube channel?
Benchmarking a YouTube channel means comparing its metrics (engagement rate, views per subscriber, upload cadence, Shorts share, growth rate) against the median of channels in the same niche AND the same subscriber band. The output is a percentile for each metric, which turns Studio's absolute numbers into a rank among peers.
Three details decide whether the benchmark is fair.
The niche filter. Finance channels sit at a 3.77 percent median engagement rate for the 100,000-to-1,000,000 sub band. Technology at the same size sits at 2.80 percent. Lifestyle at 2.84 percent. Education at 2.86 percent. Gaming at 3.20 percent (Fuse data, October 2026). A 3 percent engagement rate is below median for finance and above median for lifestyle. Without a niche filter, the number does not have a meaning yet.
The size filter. Fuse groups channels into four size buckets: nano under 10,000 subs, micro 10,000 to 100,000, macro 100,000 to 1,000,000, and mega over 1,000,000. The buckets exist because view counts scale with subscriber count. A 20,000-view video is a hit at 10K subs and a disappointment at 500K.
The cohort size. The median only means something when the cohort behind it is large enough to be stable. Fuse marks any cohort under 20 channels as low confidence. The entertainment macro bucket, at 8 channels, is a thin reference; the finance micro bucket at 856 channels is a solid one. Read the cohort size next to the percentile, not just the percentile.
The combination gives you a result like "your engagement rate is at the 54th percentile of the 284 finance channels at 100K to 1M subscribers, as of October 2, 2026." Anything less specific is not a cohort percentile.
Why does the comparison have to be niche AND size?
Audiences, formats, and view distributions change across both axes, and comparing on one without the other collapses the signal. Here is the full cohort read across Fuse's October 2, 2026 aggregates:
| Niche | Size band | p25 | p50 (median) | p75 | Cohort n |
|---|---|---|---|---|---|
| Finance | micro (10K-100K) | 1.87% | 3.18% | 4.98% | 856 |
| Finance | macro (100K-1M) | 2.73% | 3.77% | 5.00% | 284 |
| Business | micro | 1.42% | 2.56% | 3.91% | 476 |
| Business | macro | 2.38% | 3.38% | 4.32% | 184 |
| Gaming | micro | 2.70% | 3.47% | 4.84% | 69 |
| Gaming | macro | 2.73% | 3.20% | 3.67% | 34 |
| Lifestyle | micro | 1.39% | 2.29% | 3.81% | 495 |
| Lifestyle | macro | 1.68% | 2.84% | 4.12% | 336 |
| Technology | micro | 1.52% | 2.20% | 3.23% | 518 |
| Technology | macro | 1.72% | 2.80% | 3.82% | 203 |
| Education | micro | 1.46% | 2.21% | 3.82% | 124 |
| Education | macro | 1.73% | 2.86% | 3.78% | 58 |
| Entertainment | micro | 1.17% | 2.47% | 4.23% | 14 |
| Entertainment | macro | 2.17% | 3.93% | 5.59% | 8 |
Finance macro at 3.77 percent is nearly double technology micro at 2.20 percent. A tech channel at 40,000 subs with a 2.2 percent engagement rate is sitting at its cohort median. Measured against a "3 to 5 percent is a good engagement rate" rule written on finance data, the same number reads as a failure. The generic rule and the niche-specific median are not the same number.
Gaming inverts between micro and macro. The micro median is 3.47 percent and the macro median is 3.20 percent (Fuse data, October 2026). Gaming is the only niche in the table where the median engagement rate drops as the size bucket grows. The size axis matters for gaming specifically, and the generic "bigger is better" assumption does not survive the data.
Entertainment at 14 micro channels and 8 macro channels is too thin to trust. The 3.93 percent macro median has an 8-channel cohort behind it; the next channel added could move the number three percentage points. The reading here is: not enough data, do not use for comparison yet.
For a full read of the cohort math, how we calculate percentile math from the cohort stats is on the methodology page.
Which metrics should I compare my YouTube channel on?
Five metrics, each answering a different question about the channel. One metric is a vanity check, not a benchmark.
Engagement rate (likes plus comments divided by views). The question: is the audience reacting? The metric is a per-view reaction rate, nothing more.
Views per subscriber over 30 days. The question: how much of the audience is YouTube showing each video to? A channel with 100,000 subs and 158,000 views over 30 days sits at a 1.58x ratio. In the finance macro cohort as of October 2, 2026 the median views-per-sub ratio is 1.58x, with p25 at 0.56x and p75 at 3.67x (Fuse data, October 2026). A ratio below p25 for the cohort means the view count is small relative to the subscriber base; a ratio above p75 means it is large.
Upload cadence (videos per 30 days). The question: how often is the channel shipping? Compare against the niche cohort median: finance macro p50 is 8 videos per 30 days, with p25 at 1 and p75 at 24 (Fuse data, October 2026). Cadence is a lever, not a precondition, and the right target depends on the niche and the format mix.
Shorts share of the last 30 videos. The question: how heavy is the Shorts mix? In the finance macro cohort as of October 2, 2026 the median channel's last 30 videos are 3 percent Shorts, with 124 of 286 channels at zero Shorts, and p75 at 29 percent (Fuse data, October 2026). A channel over p75 is Shorts-heavy for the niche.
30-day views growth rate, month over month. The question: is the audience expanding or shrinking against the cohort? Direction and rank are different reads. Growth-rate percentiles are only as reliable as the underlying 30-day views estimate, which can be noisier than engagement rate (a direct likes-plus-comments-over-views ratio). Read growth percentiles with a wider confidence interval, and lean on the other four metrics when the growth signal is thin.
Report all five. The percentile shape across them is more useful than any single number. A channel at p80 engagement and p30 views has a different problem than a channel at p30 engagement and p80 views, and the next experiment is different in each case.
What does a benchmarked channel look like?
Erin Talks Money (@erintalksmoney) is a 439,000-subscriber personal finance channel and a clean example because her percentile shape tells a specific story (Fuse data, October 2026). Her channel sits in the finance macro cohort. Here is her October 2, 2026 read on the four metrics the free benchmark reports:
| Metric | Erin's value | Finance macro median | Erin's percentile | Cohort n |
|---|---|---|---|---|
| Engagement rate | 1.78% | 3.77% | 12th | 284 |
| Views per subscriber (30d) | 19.6x | 1.58x | 98th | 270 |
| Upload cadence (vids / 30d) | 99 | 8 | 95th | 305 |
| Shorts share (last 30 vids) | 83% | 3% | 98th | 286 |
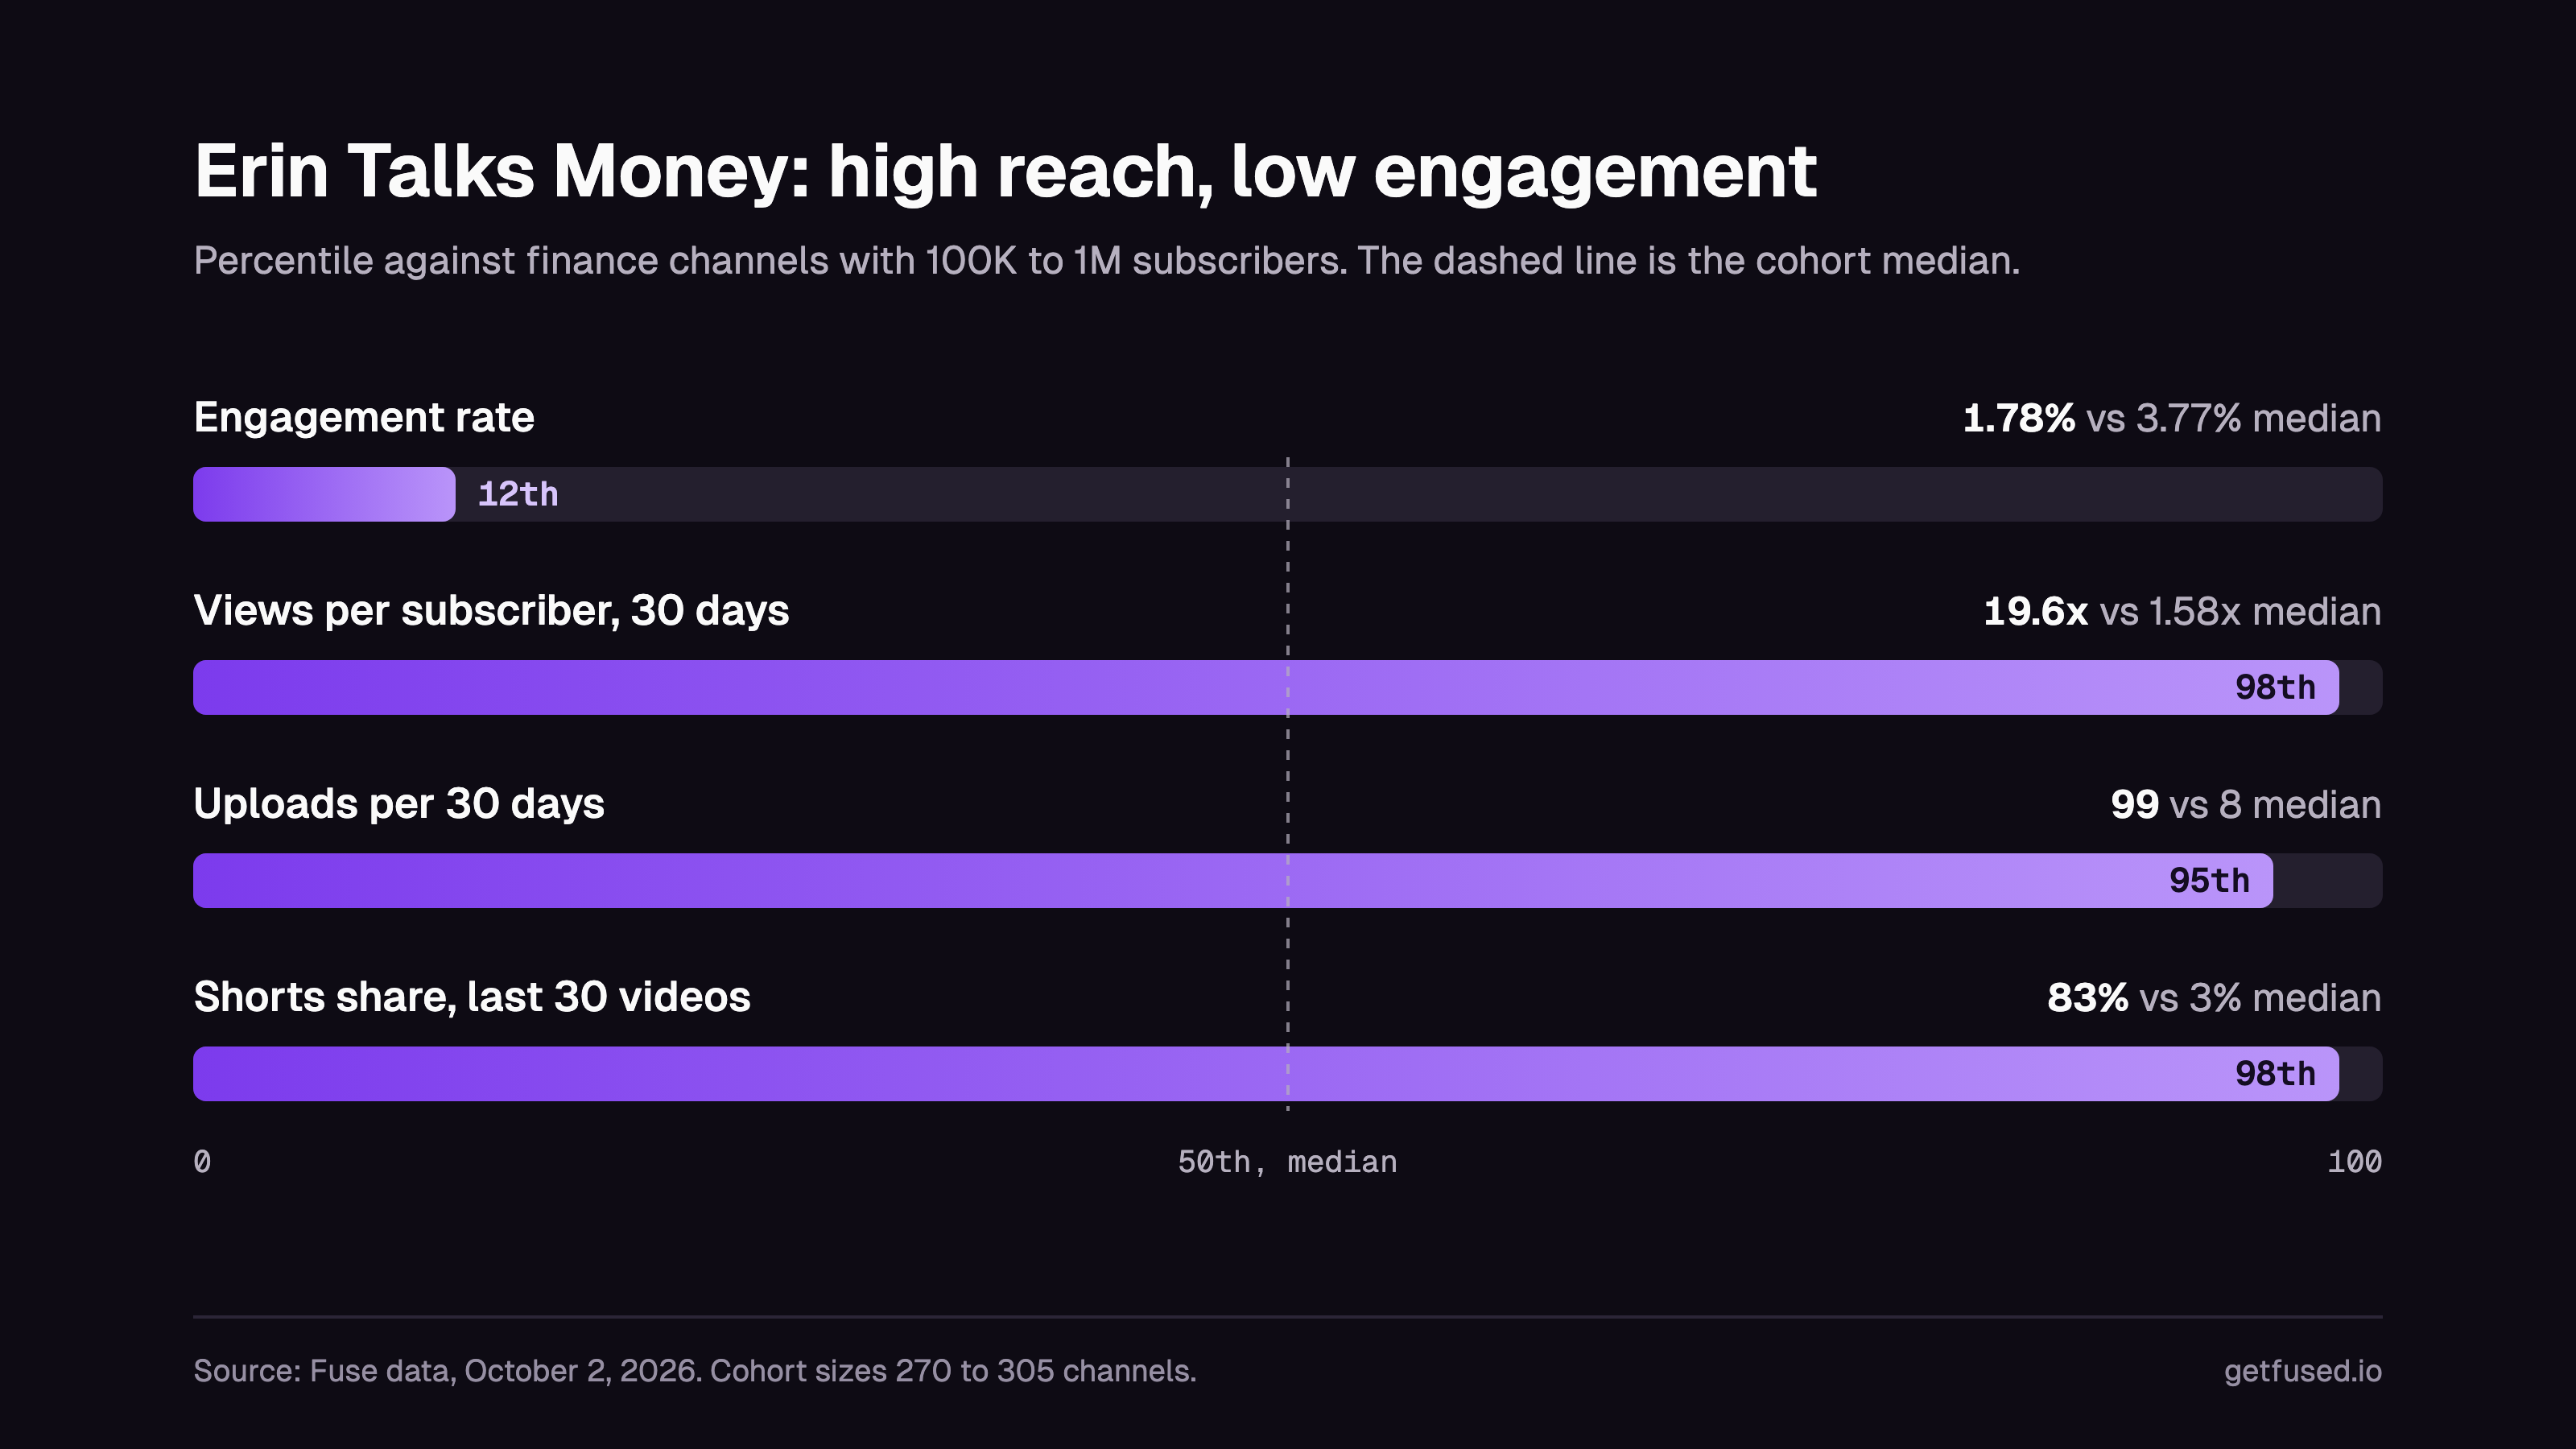
Erin Talks Money against finance channels with 100K to 1M subscribers. Source: Fuse data, October 2, 2026.
These numbers are a snapshot from October 2, 2026. The free benchmark recalculates every night, so the live figures for her channel will have moved a little by the time you check them.
Reading left to right. Erin's channel is in the top 5 percent of her cohort for views per subscriber, upload cadence, and Shorts share, and in the bottom 12 percent for engagement rate. The shape is: she produces more Shorts and more videos than almost anyone in finance macro, which pushes views per subscriber to the top; her engagement rate per view is well below the finance median.
A single-number read says "strong on volume." The four-metric read says "winning on reach and output, losing on reaction, Shorts-heavy for the niche." Those are three different conclusions, and they imply three different experiments.
Why the engagement number lands at the 12th percentile is worth looking at. Erin's upload cadence is 99 videos in the last 30 days, 83 percent of her last 30 videos are Shorts, and across her last 100 videos (published August 30 to September 20, 2026) the Shorts carry an aggregate engagement rate of 2.1 percent while the long-form videos sit at 1.7 percent (Fuse data, October 2026). Both numbers are below the finance macro cohort median of 3.77 percent. The gap is largest on the long-form side, and the long-form side is where the view count is concentrated: in that same 100-video window, her 16 long-form videos had a median of 121,972 views, her 84 Shorts a median of 5,480, a 22x ratio (Fuse data, October 2026).
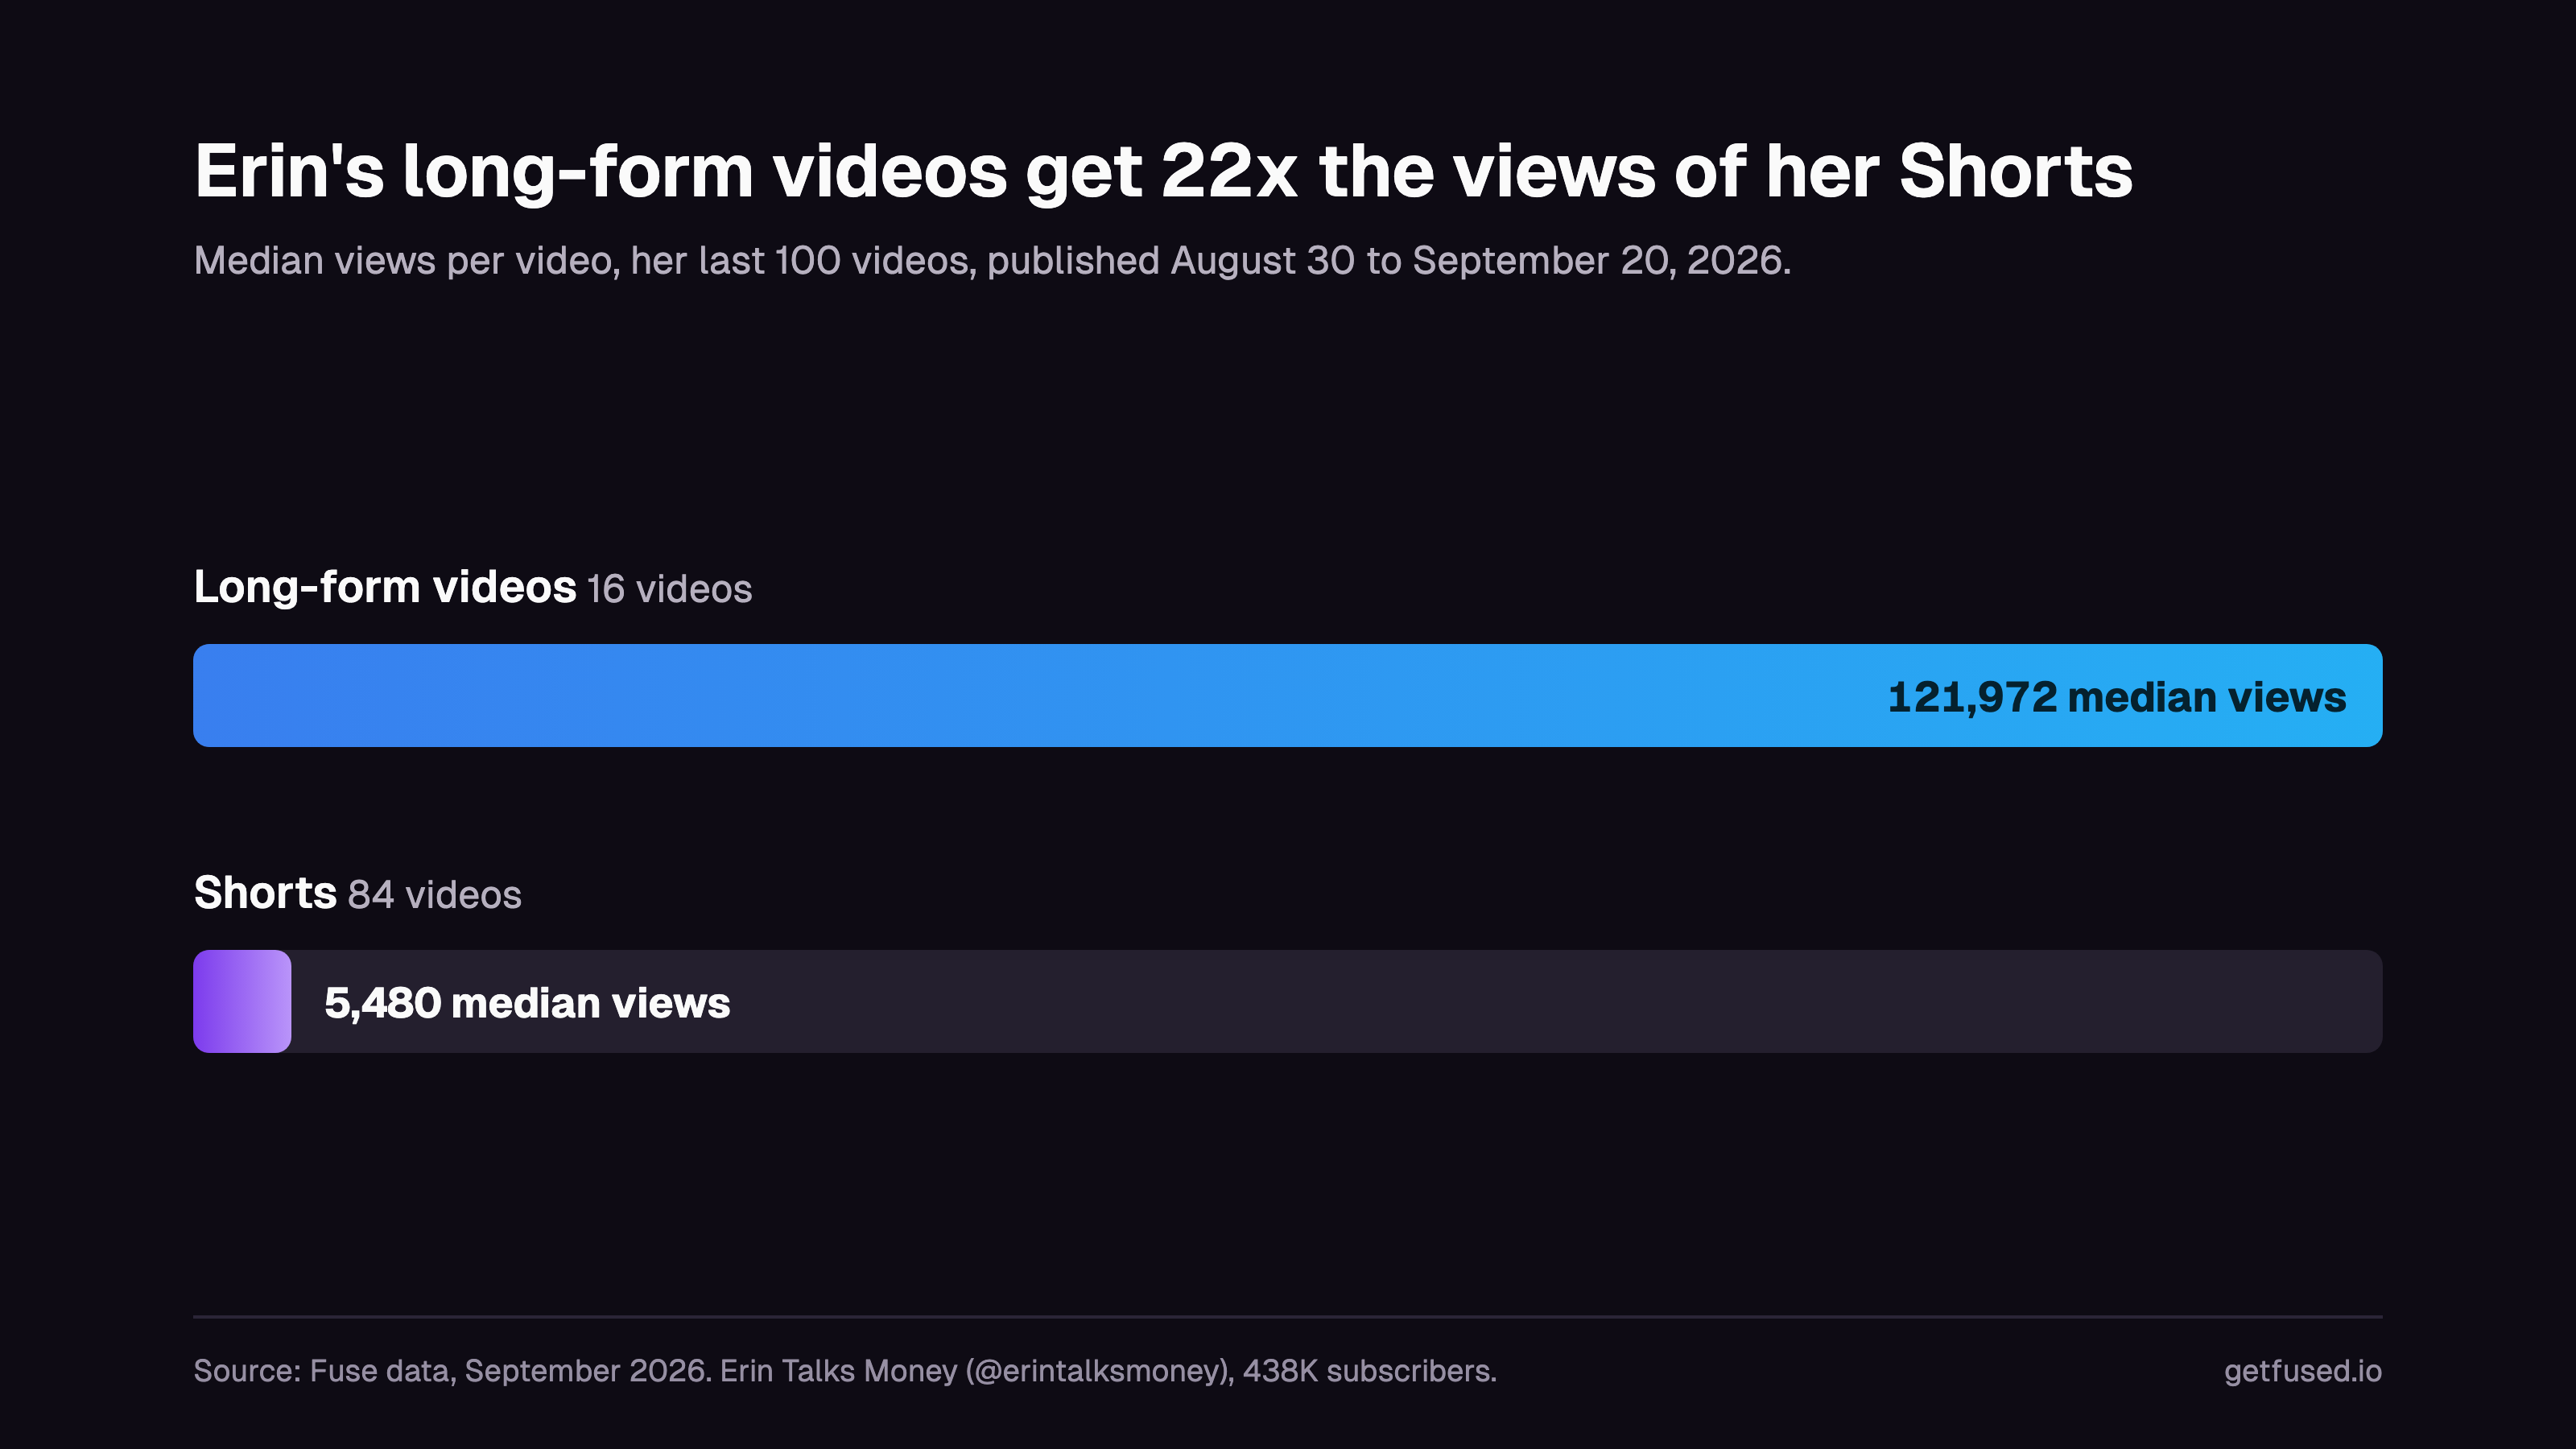
Erin Talks Money, Shorts vs long-form median view count across her last 100 videos published August 30 to September 20, 2026. Fewer long-form videos, 22x the views each. Source: Fuse data, October 2026.
The next experiment on this channel is not more views. It is a format test for reaction: a longer long-form video with a question hook, a comment prompt in the first 60 seconds, or a format shift toward panel-style interviews that invite replies. Those are testable. The benchmark is what identified reaction as the lever, not reach.
How do I benchmark my channel for free?
The fastest way is Fuse's free channel benchmark. Paste a public handle, Fuse looks up the primary topic and size bucket, pulls the latest canonical aggregate for that cohort, and interpolates each of the four metrics (engagement, views per subscriber, upload cadence, Shorts share) against the stored percentile curve. The output is the same shape as the Erin table above. No account, no card.
The manual Studio method is also doable: pull your last 30 days of views and engagement from Studio, then look up 15 to 20 same-niche same-size peers one at a time at the channel-stats tool and sort to see where you land. Allow an hour per peer set. The tool is a paste.
What is a good engagement rate on YouTube in 2026?
Depends on the niche and size. The citeable medians are in the big engagement table above. Across Fuse's cohorts as of October 2, 2026, median engagement rates sit between 2.20 percent (technology micro) and 3.93 percent (entertainment macro, thin cohort of 8). The middle 50 percent of outcomes for a channel in a well-populated niche is between 2.5 and 4.0 percent, with the exact band depending on the cohort.
The general-purpose rules of thumb circulating online (3 to 5 percent is good, under 2 percent is bad, over 7 percent is strong) match the shape of the finance macro distribution. In technology micro, the same 3-to-5 band is already at or above the cohort 75th percentile of 3.23 percent.
A specific channel's target is the 75th percentile of its own cohort. The big table above lists p75 for every niche-and-size pair. Engagement above p75 means the channel is strong on that axis for its cohort, and the next lever is a different one.
How do I read a percentile result?
A percentile is a position in a sorted list. If a channel's engagement rate percentile is 54, its rate is higher than 54 percent of the channels in its cohort and lower than 46 percent. Not better. Higher. Those are different.
One percentile is a point. Five percentiles are a shape. The shape tells you where to look. Erin's shape is reach high, reaction low. A different channel at p80 engagement and p30 views has a reach problem, not a reaction problem.
The cohort size matters more than the number. A 54th percentile against 284 peers is a stable reading. A 54th percentile against 8 peers is noise. Fuse marks cohorts under 20 as low confidence. Trust the percentile roughly in proportion to the cohort size.
The percentile is a snapshot. It moves. Cohort medians move too, as new channels enter and existing channels change their mix. A percentile from six months ago is not comparable to one from this week. Benchmark monthly and read the trajectory.
Percentiles are also bounded by the stored curve. Fuse's canonical aggregates store p10, p25, p50, p75, p90, p95, so results clamp between roughly the 10th and the 95th. The reader will never show a 99th percentile because the data cannot support it. A clamped reading is a clue the real value is outside the measured band, not a precise rank.
What should I do with my benchmark results?
Pick the strongest metric and the weakest, read both, then design one experiment for the weakest. Not three. One.
The strongest metric is the lever that is working. Keep pulling it. If a channel's engagement rate is at the 85th percentile, the audience is reacting at a rate above most of the cohort, and the next move is usually more of what the channel is already doing, not a format change.
The weakest metric is the constraint. Design one small experiment that targets it:
- Weakest is engagement rate: test a format or hook that invites reaction. A question in the title, a comment prompt in the first 60 seconds, a format that is naturally reactive (ranking, hot takes, interviews).
- Weakest is views per subscriber: if views-per-sub is the low percentile, the next test in this post is titles and thumbnails. Package three variants of the same video idea, ship weekly, read CTR in Studio.
- Weakest is upload cadence: calendar the next 4 videos before you ship the current one. Shoot in a batch, release weekly.
- Weakest is Shorts share (too high): pause Shorts for 30 days, measure the shift in long-form view performance. This is reversible. Measure before you commit.
- Weakest is growth rate: check whether the cohort accelerated or the channel decelerated. If the cohort moved, the problem is relative; look at what the top-decile peers published this month and read for a format or topic shift.
Ship one experiment, wait 30 days, re-benchmark. If the weak percentile moved up, the experiment was correct. If it did not move, try a different lever. The benchmark picks the next test, it does not grade the channel.
Which tools benchmark YouTube channels, and what do they cost?
Every YouTube analytics tool offers some version of competitor comparison. The differences come down to whether the comparison is cohort-based (niche AND size) or competitor-pick (you choose peers manually), whether it needs a signup, and what the paid tier adds. Prices below are from each vendor's public pricing page. OutlierKit and Viewstats were re-verified on 2026-09-30; the others carry forward from the September 23 check in the analytics tools roundup. Vendor plans change often, so check before you buy.
| Tool | Comparison type | Niche + size filter | Signup? | Free tier? | Paid entry price (Sept 2026) | Notes |
|---|---|---|---|---|---|---|
| Fuse | Cohort (niche + size) | Yes, four size bands and seven primary topics | No for the free channel benchmark | Yes, any public channel | Pro 12 dollars/mo | Percentile math on nightly aggregates. Pro adds historical trend and multi-channel comparison. |
| YouTube Studio | Own channel only | No | Yes, channel owner | Yes, always free | Free | No peer comparison. Studio shows your numbers, not where they land. |
| vidIQ | Competitor pick (you choose peers) | No, you pick the channels | Yes | Limited free | Boost 16.58 dollars/mo billed yearly | Competitor comparisons sit on the paid Boost tier. Max tier is 39 dollars/mo billed yearly. |
| TubeBuddy | Competitor pick (Competitor Scorecard) | No | Yes | Limited free | Pro 12 dollars/mo | Competitor Scorecard is on Legend, 26.39 dollars/mo. Full version on Enterprise, custom pricing. |
| Viewstats | Competitor pick | Partial | Yes | Limited free | Pro, price gated on pricing page | Business tier is 249 dollars/mo. Competitor comparison features live on Pro. |
| Social Blade | Category rank, no size filter | Niche only, no size | Not required for the public page | Yes, public page | 5 dollars/mo billed yearly | Ranks against the whole category, including giants. Not comparable within a size band. |
| OutlierKit | Niche-wide outlier comparison | Niche only, no size filter | Yes | 30-credit trial | Hobby 16.60 dollars/mo billed annually, Pro 24.90 dollars/mo billed annually | Outlier-focused, not a general-purpose benchmark. Credits consumed per run. |
If you want a cohort-based benchmark against the same niche and the same size band, Fuse is the only free option in the table. If you already pay for vidIQ or TubeBuddy, their competitor-pick views are the paid alternative. Social Blade is useful for a quick public read, but it ranks against the whole category, so a 50K channel competes with the 100M channels, and the number is not a size-band benchmark.
The deeper feature comparison on these tools, beyond the benchmark question, is in the analytics tools roundup. What Fuse Pro adds on top of the free channel benchmark covers the paid-tier differences.
Do benchmarks work for small channels?
Yes, above 1,000 subs and 10 videos. Under 1,000 subs, Fuse marks the sizeBucket as nano, and the nano cohorts in some niches have fewer than 20 channels, which pushes the reading to low confidence. Under 10 videos, the channel does not have enough view distribution for the percentile math to stabilize.
A 50,000-sub tech channel measured against the generic "4 percent engagement is good" rule is being measured against finance channels. The real tech micro median is 2.20 percent and the p75 is 3.23 percent (Fuse data, October 2026). A 2.5 percent engagement rate on that channel is above cohort median, not below the rule-of-thumb target.
The practical floor for a useful benchmark: 1,000 subs, 10 videos, a classified primary topic, and a cohort of 20 or more peers. Under that, benchmarks give direction with caveats. Over that, they give a reliable position.
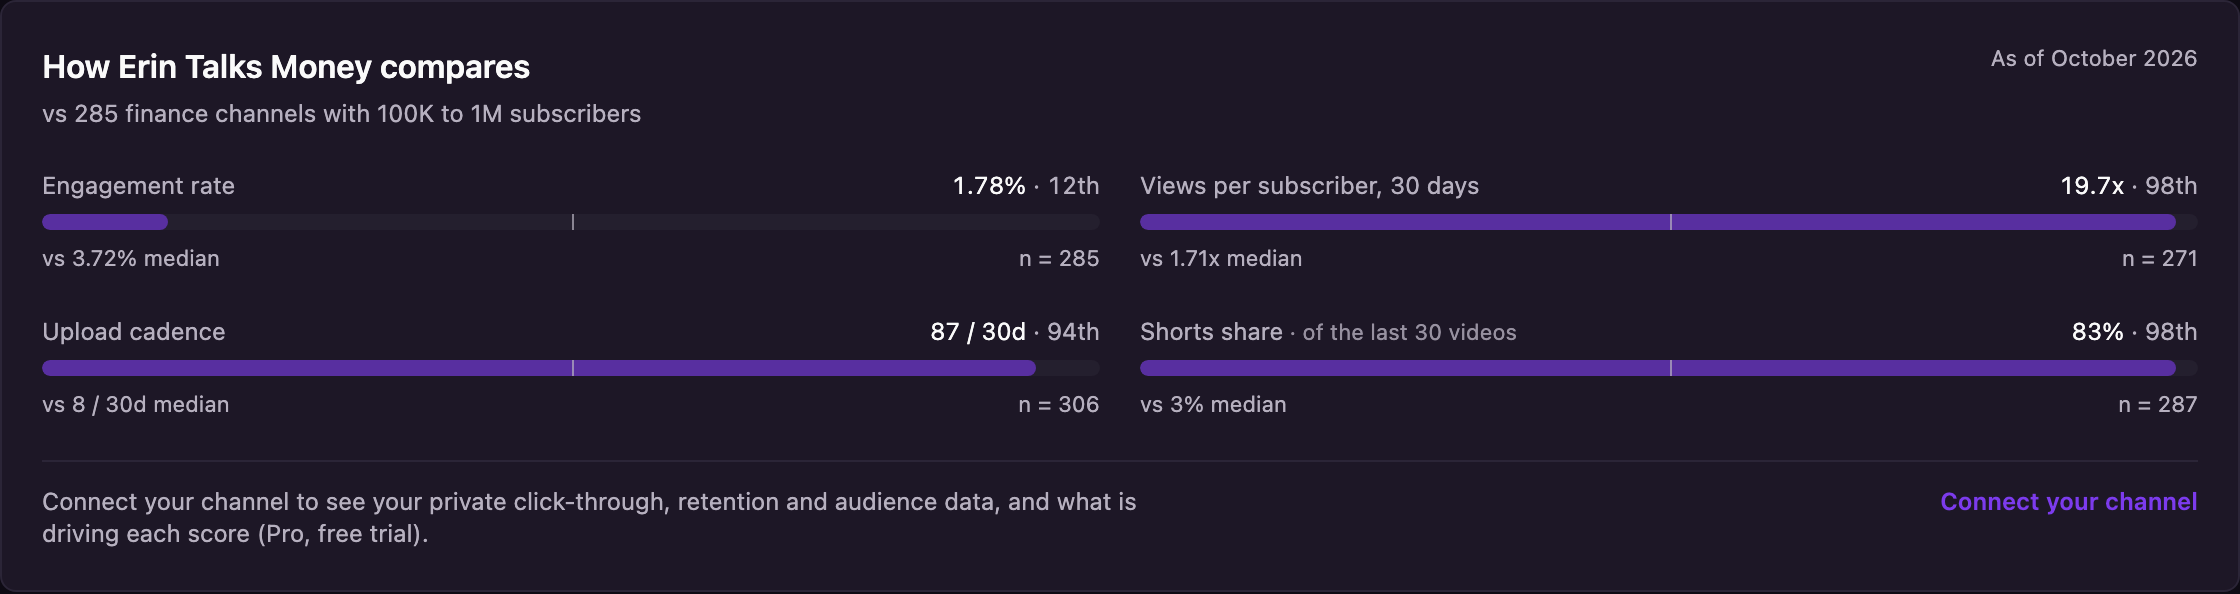
The free channel benchmark on Fuse for the same channel, captured October 5, 2026. The cohort refreshes nightly, so its numbers have moved slightly since the October 2 snapshot above.
Frequently asked questions
- How does my YouTube channel compare to similar channels in my niche?
- The answer is a percentile against peers in the same niche AND the same subscriber band, not a single grade. A finance channel at 400,000 subs is compared with the other finance channels at 100,000 to 1,000,000 subs. Fuse computes that comparison on 284 finance channels in the macro size band as of October 2, 2026 (Fuse data, October 2026).
- What is a good engagement rate on YouTube in 2026?
- Depends on the niche and size. Finance macro channels (100,000 to 1,000,000 subs) sit at a 3.77 percent median engagement rate. Technology micro channels (10,000 to 100,000 subs) sit at 2.20 percent. Lifestyle, education, and entertainment micro medians cluster between 2.21 and 2.47 percent (Fuse data, October 2026). A 3 percent rate is strong in tech and weak in finance.
- Is 2 percent engagement bad on YouTube?
- Not without context. 2 percent is below median for finance and gaming channels, roughly at the median for technology micro channels at 2.20 percent, and above median for channels whose Shorts share pulls the engagement number down. The question is which niche and which size band you are comparing against (Fuse data, October 2026).
- What size channels should I compare mine to?
- The channels in your subscriber band. Fuse groups channels into four buckets: nano (under 10,000), micro (10,000 to 100,000), macro (100,000 to 1,000,000), and mega (over 1,000,000). Comparing a 50,000-subscriber channel to a 500,000-subscriber channel in the same niche is apples to oranges on views and reach, which is why the two filters matter together.
- Why do my views look big but my percentile is low?
- The view count can rank at the top of the cohort while engagement rate ranks at the bottom. Erin Talks Money sits at the 98th percentile for views per subscriber in finance macro and the 12th percentile for engagement rate across the same 284-channel cohort (Fuse data, October 2026). The percentile reads the trade-off that the raw numbers hide.
- How often should I benchmark my channel?
- Benchmark monthly, and after any change in format or upload cadence. The underlying cohort medians move slowly, so weekly checks mostly show noise. Monthly catches shifts worth responding to: a new sub band, a drop in engagement after a format change, or a growth-rate percentile falling because the cohort accelerated and the channel did not.
- Can I benchmark a channel I don't own?
- Yes, on public data. Fuse computes percentiles for any public channel in the dataset, with no account, at the free channel benchmark. YouTube Studio only shows your own. vidIQ, TubeBuddy, and Viewstats all surface competitor comparisons behind an account and a paid tier.
- Do YouTube Shorts count in the benchmark?
- Yes, and they show up most visibly in the Shorts share metric. A Shorts-heavy channel will have a different Shorts share percentile from a long-form-heavy channel in the same cohort. In finance macro the median Shorts share of the last 30 videos is 3 percent, with p75 at 29 percent (Fuse data, October 2026). The Shorts share percentile tells the reader where the mix sits.
- What is a good views-per-subscriber ratio?
- Depends on the niche. In finance macro as of October 2, 2026 the median views-per-sub ratio over 30 days is 1.58x, with p25 at 0.56x and p75 at 3.67x (Fuse data, October 2026). Compare the ratio against the same niche and size band, not a universal rule.
- Why is my channel's growth percentile low if my subscriber count is growing?
- Because the growth percentile measures the rate against the cohort, not the direction. A channel adding 500 subs per month is growing in absolute terms, but if the median channel in the same niche and size band added 2,000 subs per month, the growth percentile is low. Direction and rank are different questions.
- Do benchmarks work for small channels?
- Yes, once the channel is above 1,000 subscribers and has at least 10 videos. Under that, the cohort math is too thin and the Shorts/long split too narrow for the comparison to carry signal. Fuse marks small-cohort reads as low confidence rather than hiding them.
- What should I do with my benchmark result?
- Pick the weakest metric and the strongest, read both. The strong metric is the lever that is working, keep pulling it. The weak metric is the next thing to test. If engagement is bottom quartile but views are top decile, the next experiment is a content format that invites reaction, not more reach.
Nick Julia
Written by Nick Julia.
Related reading
YouTube Analytics
How to Audit a YouTube Channel in 10 Minutes (Free Checklist)
Audit any public YouTube channel in 10 minutes with the free 7-step checklist, live niche benchmarks, and a worked example on Pati Jinich using Fuse data.
October 11, 2026 · 11 min read
YouTube Analytics
Best YouTube Analytics Tools 2026: An Operator's Comparison
An operator's comparison of the six YouTube analytics tools worth using in 2026: Fuse, vidIQ, TubeBuddy, Social Blade, YouTube Studio, and Noxinfluencer.
September 24, 2026 · 9 min read
YouTube Analytics
How to Find Your YouTube Outlier Videos (Free, No Signup)
A YouTube outlier video earns 3x or more the channel's median views. Here is how to find yours on any channel, free, no signup, plus what to make next.
September 24, 2026 · 10 min read