
YouTube Analytics
How to Audit a YouTube Channel in 10 Minutes (Free Checklist)
Updated October 11, 2026 · 11 min read
TL;DR
A YouTube channel audit measures four percentiles against niche-and-size peers: engagement, views per subscriber, upload cadence, and Shorts share. YouTube Studio shows absolute numbers in isolation and gives you no peer frame. A worked example on Pati Jinich (@patijinich, 133,000 subs) runs all seven steps with Fuse data from October 9, 2026.
YouTube Studio reports one channel. It shows views, retention, and click-through rate, and it has no peer frame. The absolute numbers are legible. The context against similar channels is not there.
A channel audit is the peer comparison Studio does not run. It compares a channel against the real distribution of channels publishing in the same niche at the same size. The output is four percentiles.
What is a YouTube channel audit?
A YouTube channel audit is a short read of a channel's engagement, reach, cadence, and Shorts mix measured against the median of peers in the same niche and the same subscriber band, with the four percentile metrics defined below. The audit requires 1,000 or more subscribers, 10 or more uploads, and a cohort of 20 or more peers; reads below any of those thresholds are marked low confidence or skipped.
| Metric | Formula | Cohort | What the percentile means |
|---|---|---|---|
| Engagement rate | likes + comments / views | Same primary topic and size band | Rank of this ratio among 20+ niche-and-size peers from the latest nightly aggregate. |
| Views per subscriber (30d) | views30d / subscribers | Same primary topic and size band | Rank of the 30-day views-per-subscriber ratio among the same cohort. |
| Upload cadence | videos published in last 30 days | Same primary topic and size band | Rank of the 30-day upload count among the same cohort. |
| Shorts share | Shorts in last 30 videos / 30 | Same primary topic and size band | Rank of the Shorts share of the last 30 uploads among the same cohort. |
The audit is not a video-level read. It does not open individual uploads and judge retention curves or packaging. It reads the whole channel's recent 30-day shape against the distribution of similar channels. That distribution is the thing Studio does not have.
Three framing lines carry the method.
Cohort beats absolutes. A 2 percent engagement rate is below median in finance and above median in technology micro (Fuse data, October 2026). The number does not have a reading until the cohort fixes it.
Shape beats any one metric. A channel with a high engagement percentile and a low views-per-subscriber percentile is a different pattern from a channel with the opposite. The pattern across the four is the read.
Direction without rank is incomplete. A subscriber count going up is positive, but the comparison that matters is rank against the cohort, not direction alone.
How do I audit a YouTube channel in 10 minutes?
Run the seven steps below in order. Each step pulls one number, says what it is measured against, and says what "good" looks like for the niche and size. If a step turns up a blocking data gap (a channel under 1,000 subscribers, or a cohort of fewer than 20 peers), skip the step and flag the gap. Do not fabricate the number.
Step 1. Figure out your cohort. Pick the primary topic and the subscriber band. Primary topic is one of seven: business, technology, finance, gaming, lifestyle, entertainment, education. Subscriber band is one of four: nano under 10,000, micro 10,000 to 100,000, macro 100,000 to 1,000,000, mega 1,000,000 or more. The pair fixes the comparison for every step after this one. A finance macro channel compares to the other finance channels at 100,000 to 1,000,000 subs, not to finance in general and not to all macro channels in general.
Step 2. Engagement rate percentile. Pull the channel's engagement rate: likes plus comments divided by views. Fuse uses each channel's lifetime totals from YouTube's channel statistics, so the ratio covers every video the channel has published, Shorts included. Compare it to the cohort's median. A finance macro channel at 3.77 percent is at the cohort median; a lifestyle macro channel at 2.80 percent is also at its median (Fuse data, October 2026). What matters is the percentile against the right cohort, not the raw number.
Step 3. Views per subscriber (30 days) percentile. Pull the channel's 30-day views and divide by subscriber count. This is the views-per-subscriber ratio. Compare the ratio to the cohort median. The lifestyle macro median is 2.14x (Fuse data, October 2026); finance macro is 1.58x. The ratio does not identify the traffic source. A ratio below cohort p25 is below the cohort's lower quartile on 30-day views per subscriber, nothing more and nothing less.
Step 4. Upload cadence percentile. Count the videos the channel published in the last 30 days. Compare to the cohort's cadence median. The lifestyle macro median is 5 videos over 30 days; finance macro is 8 (Fuse data, October 2026). Cadence is a lever, not a precondition. A channel at p40 cadence is not necessarily wrong, but if views per subscriber is also low, cadence may be the lift to try first.
Step 5. Shorts share percentile and the Shorts versus long-form split. Compute the share of the last 30 videos that were Shorts. Compare the share to the cohort median. In lifestyle macro the median channel's last 30 videos are 23 percent Shorts (Fuse data, October 2026); finance macro is 3 percent. Then compute the Shorts median view count and the long-form median view count separately on the channel's own last 30 to 100 uploads. The ratio between the two is the Shorts-vs-long-form view multiple for the channel. Read it alongside the Shorts share percentile. A high Shorts share with a wide view multiple is one pattern; a low Shorts share with a narrow multiple is another; the pattern is a channel-level read, not a cohort claim.
Step 6. Find the top three breakout videos. A breakout is a video that earned at least 3x the channel's median view count for videos of similar age. Pull the last 60 to 100 uploads, compute the median view count for Shorts and long-form separately, flag anything above 3x. The question: what did these three or four videos share? Topic, title pattern, format, thumbnail style, or runtime. One shared factor across all three is the format bet to run next. How to find YouTube outlier videos goes deeper on the method and the threshold.
Step 7. Growth direction, with a confidence caveat. Pull the channel's 30-day views compared to the previous 30 days. Note the direction and the percentage change. The growth signal is noisier than the four percentile metrics above. Fuse's own cohort-level growth read is unstable on the October 2026 snapshot (the cohort medians are negative across every niche sampled, which looks like an aggregate-pipeline artifact rather than reality), so this audit does not compare growth to a cohort median yet. Read growth direction on the channel itself, weight it lower than the four percentile metrics, and lean on the other six steps when growth is thin.
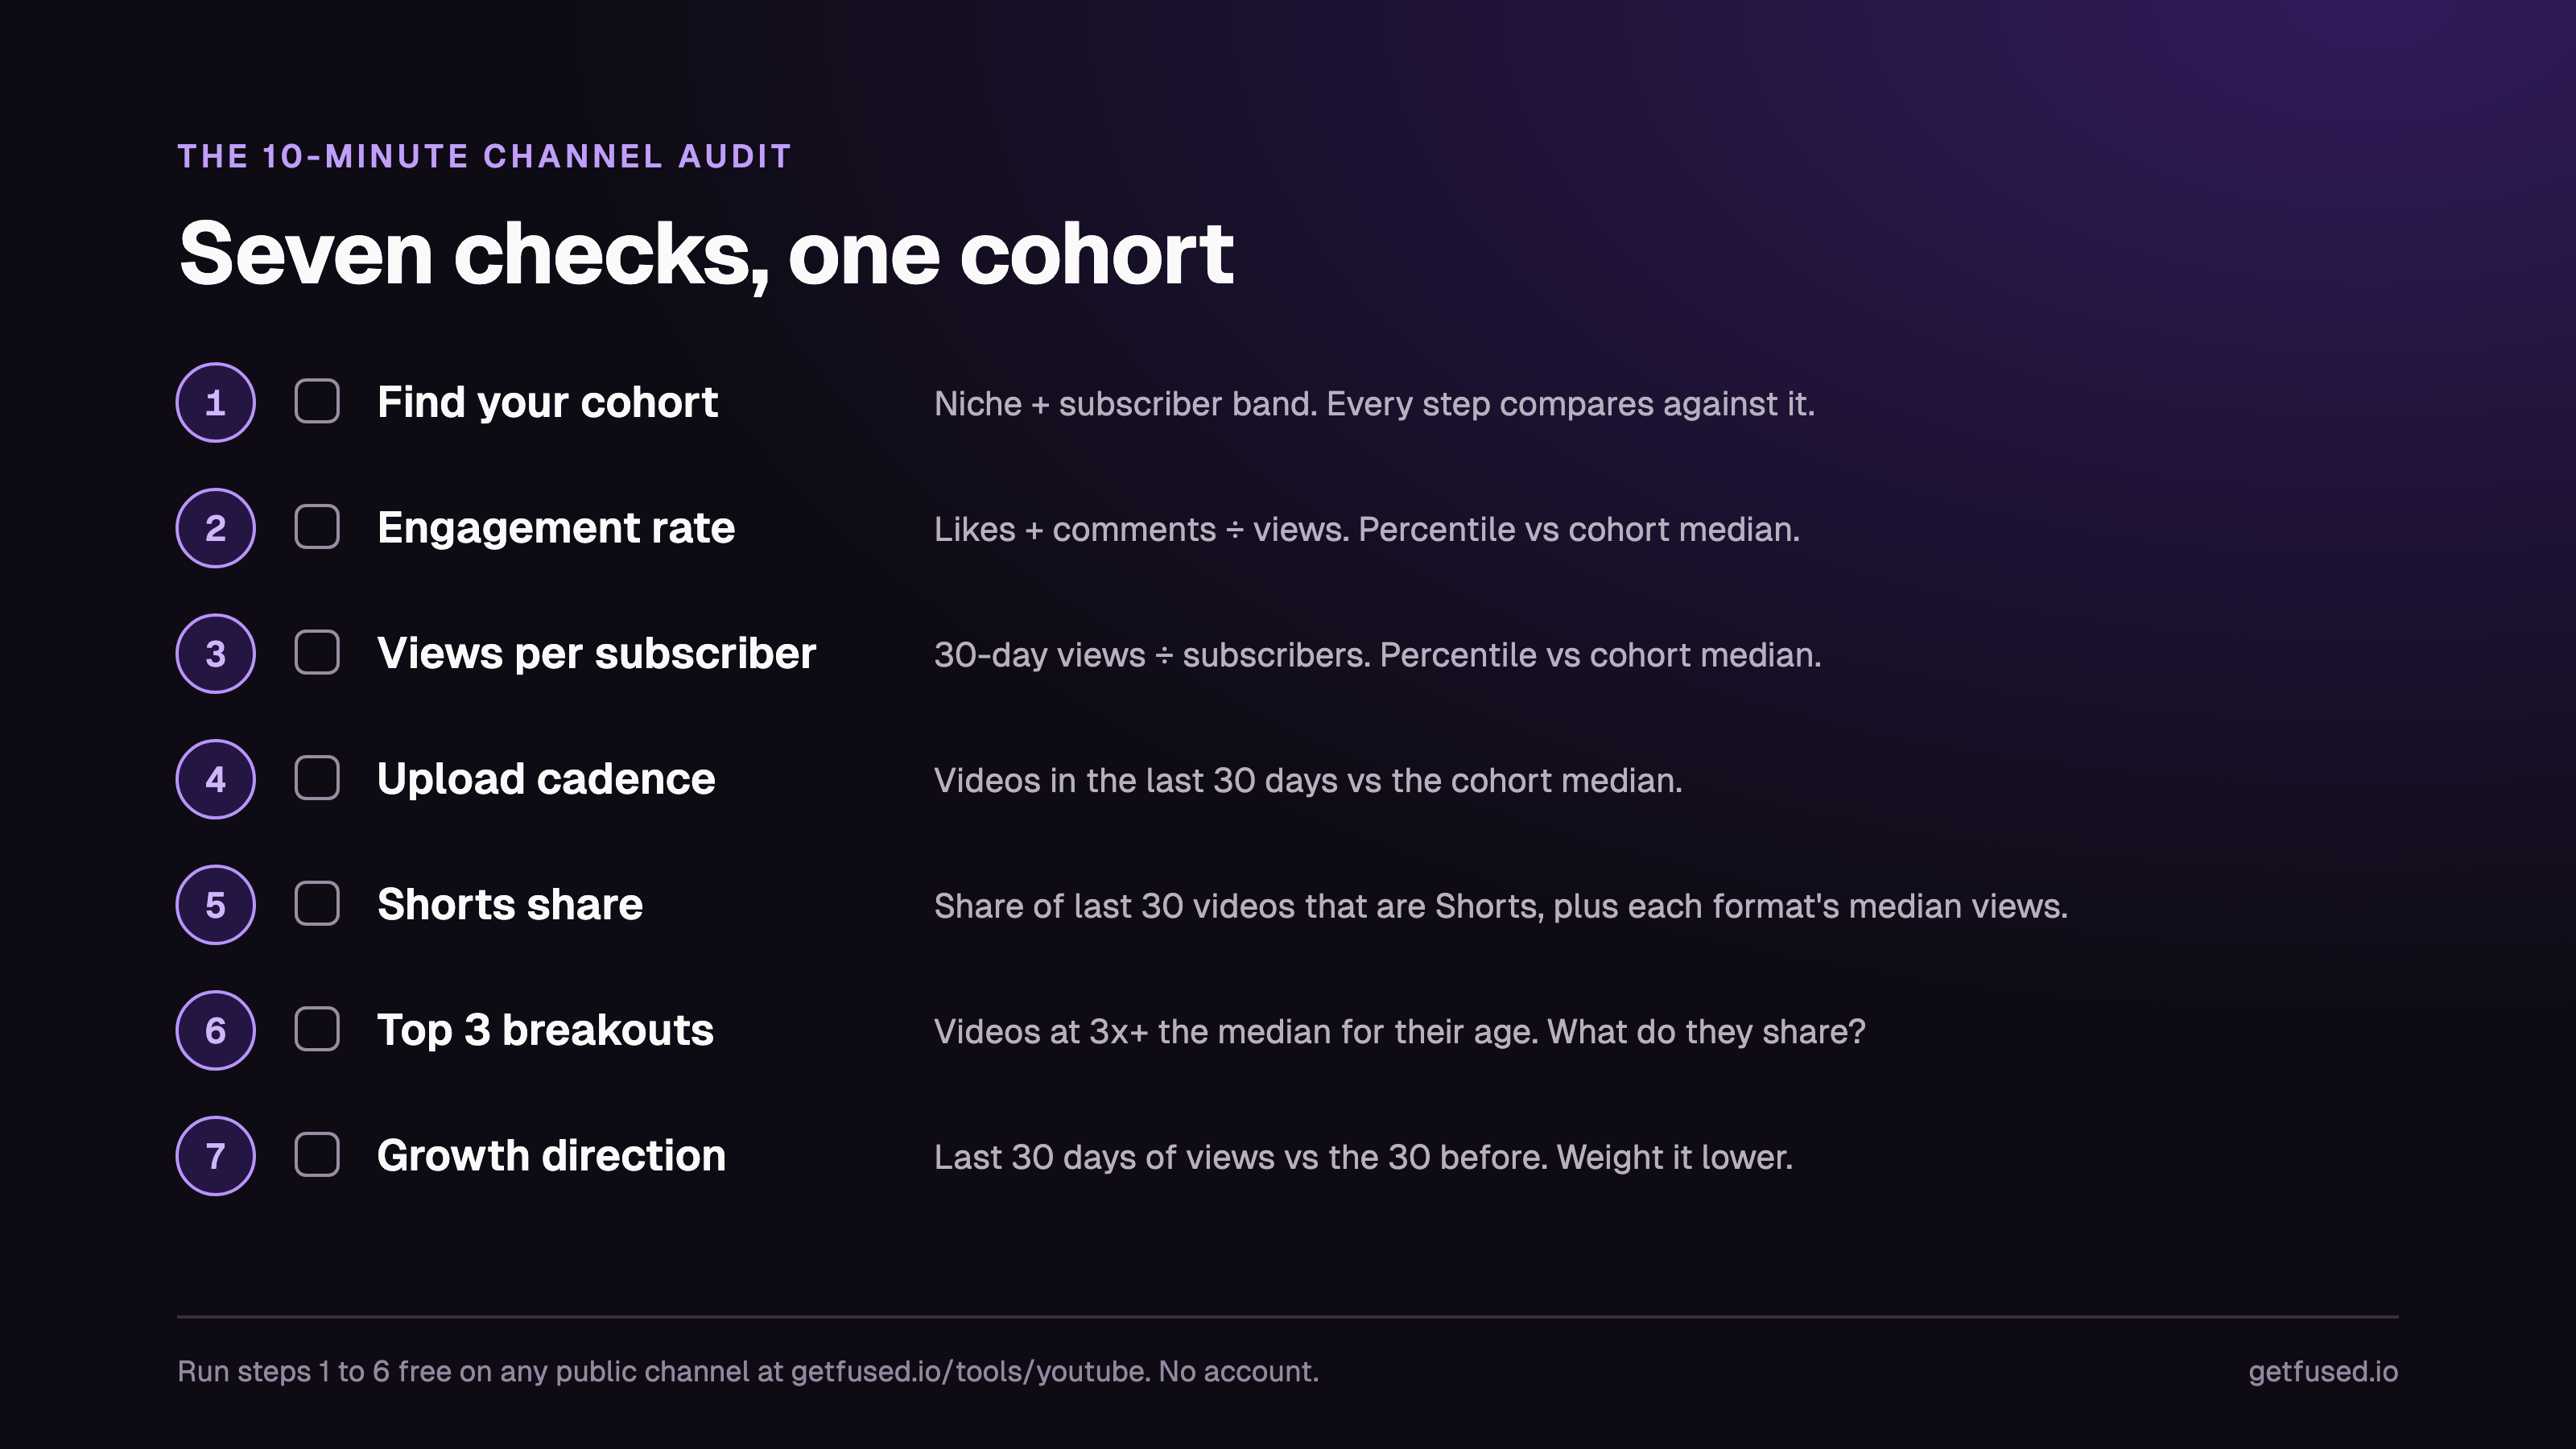
That is the operational audit. For a deeper read on any single step, three cluster posts carry the method:
- Steps 2 to 5 (the four percentile metrics): YouTube channel benchmarks: what is normal for your niche and size
- Step 6 (breakouts and the 3x rule): How to find YouTube outlier videos
- The tool question underneath every step: Best YouTube analytics tools 2026, compared
Niche-specific cohort pages: Finance, Lifestyle, Gaming, Technology, and Business creators on Fuse.
The next section runs the audit on a real channel.
What does a channel audit look like on a real channel?
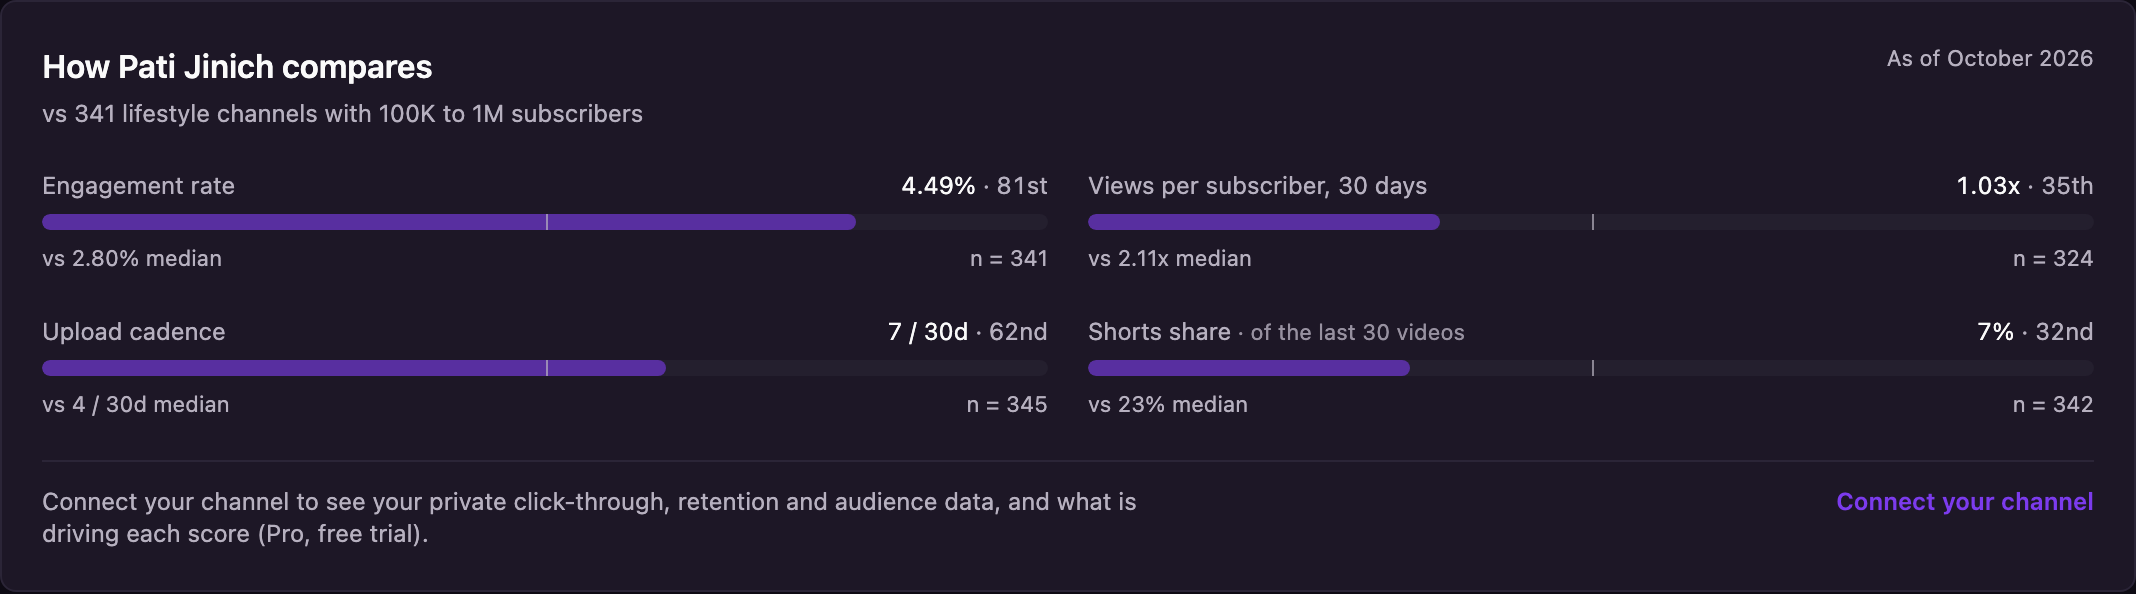
Pati Jinich (@patijinich, 133,000 subs) is the public cooking show host behind "Pati's Mexican Table" on PBS and a clean example because the audit's output tells a specific story (Fuse data, October 2026). Her channel sits in the lifestyle macro cohort. Here is her October 9, 2026 read on the four main metrics:
| Metric | Pati's value | Lifestyle macro median | Pati's percentile | Cohort n |
|---|---|---|---|---|
| Engagement rate | 4.49% | 2.80% | 80th | 341 |
| Views per subscriber (30d) | 1.07x | 2.14x | 33rd | 319 |
| Upload cadence (vids / 30d) | 8 | 5 | 61st | 342 |
| Shorts share (last 30 vids) | 7% | 23% | 29th | 339 |
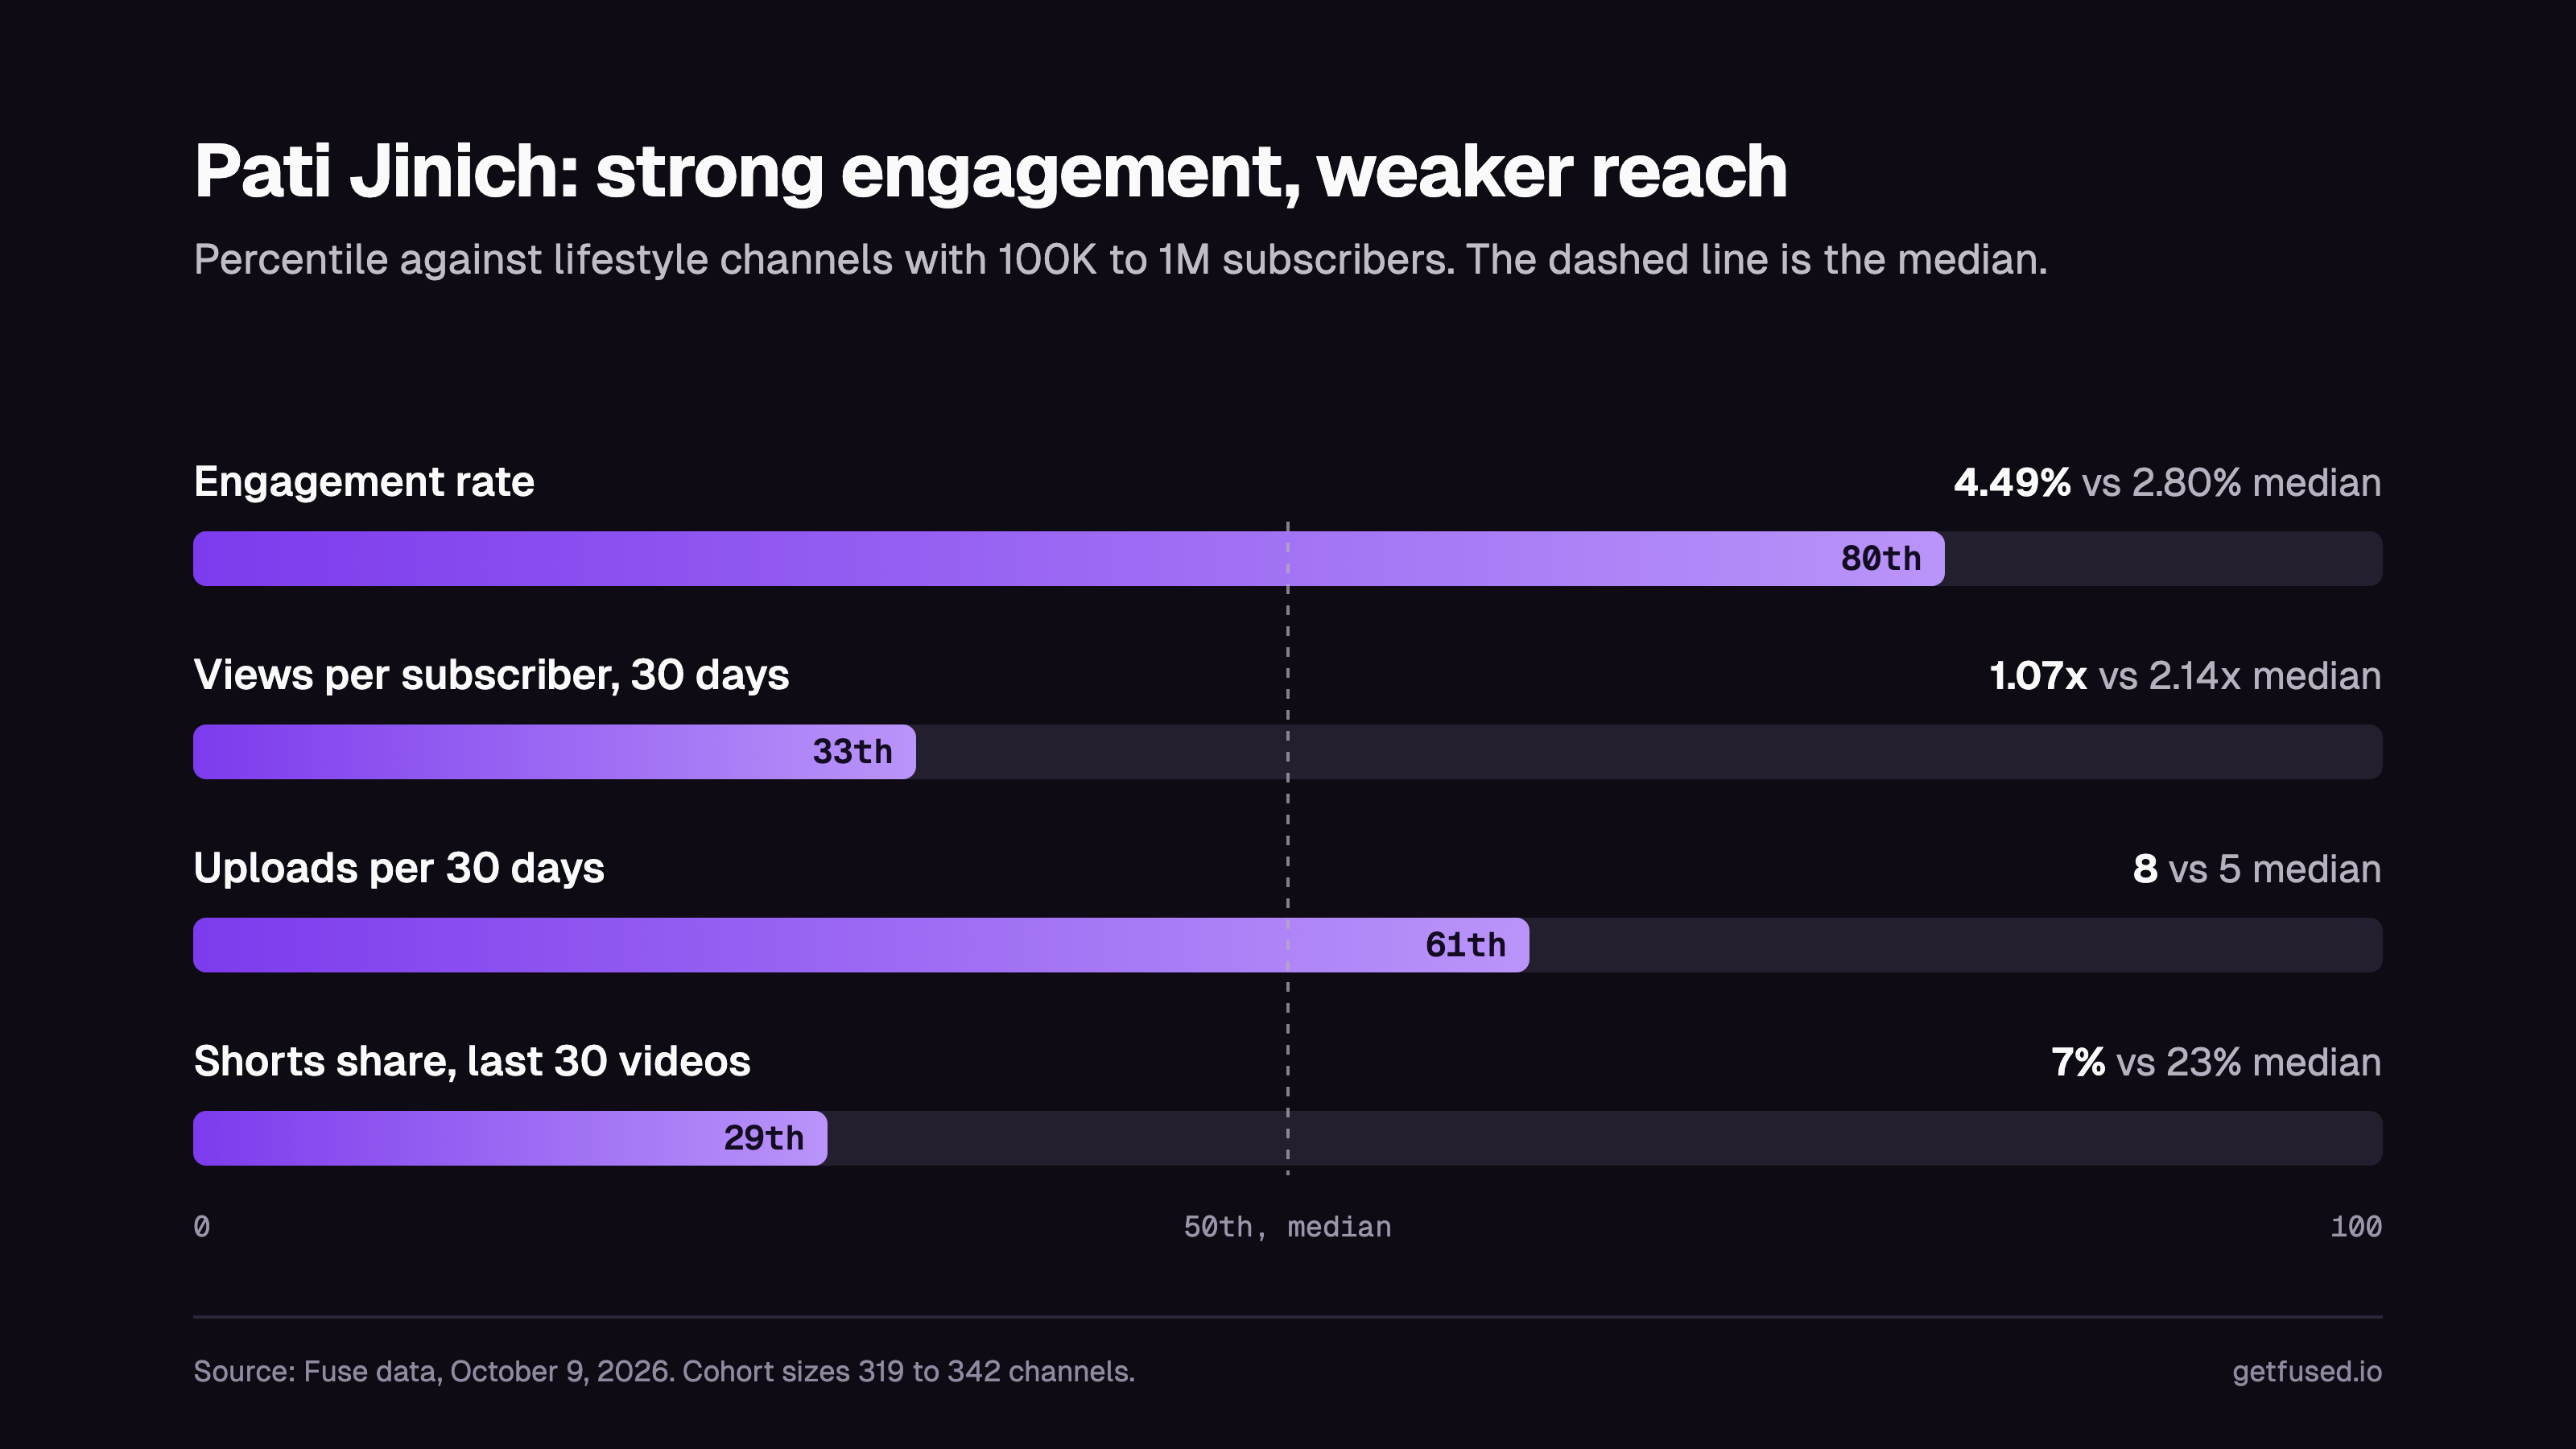
These numbers are a snapshot from October 9, 2026. The free benchmark tool recalculates every night, so the live figures will have moved by the time you check them.
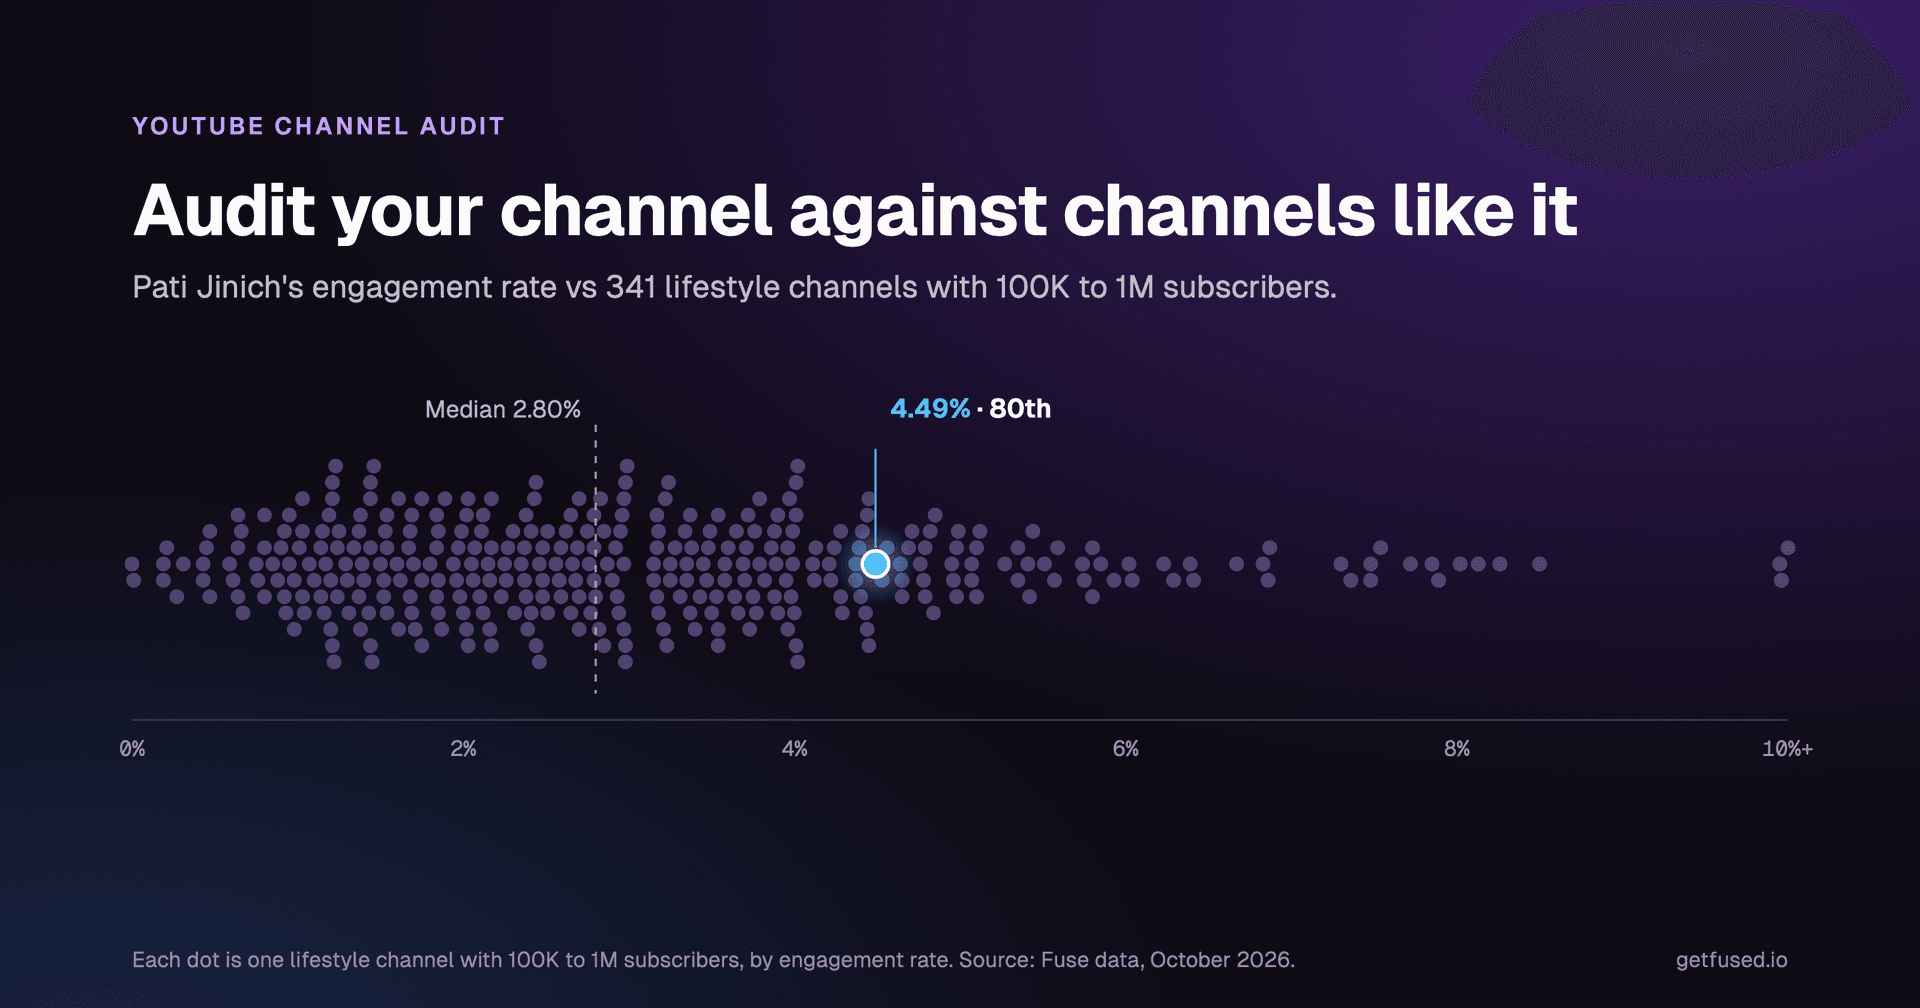
Reading left to right. Pati's engagement rate is at the 80th percentile of her cohort. 4.49 percent is above the lifestyle macro median of 2.80 percent and above the cohort p75 of 4.02 percent. That is the 80th percentile of 341 lifestyle macro channels on this snapshot (Fuse data, October 2026).
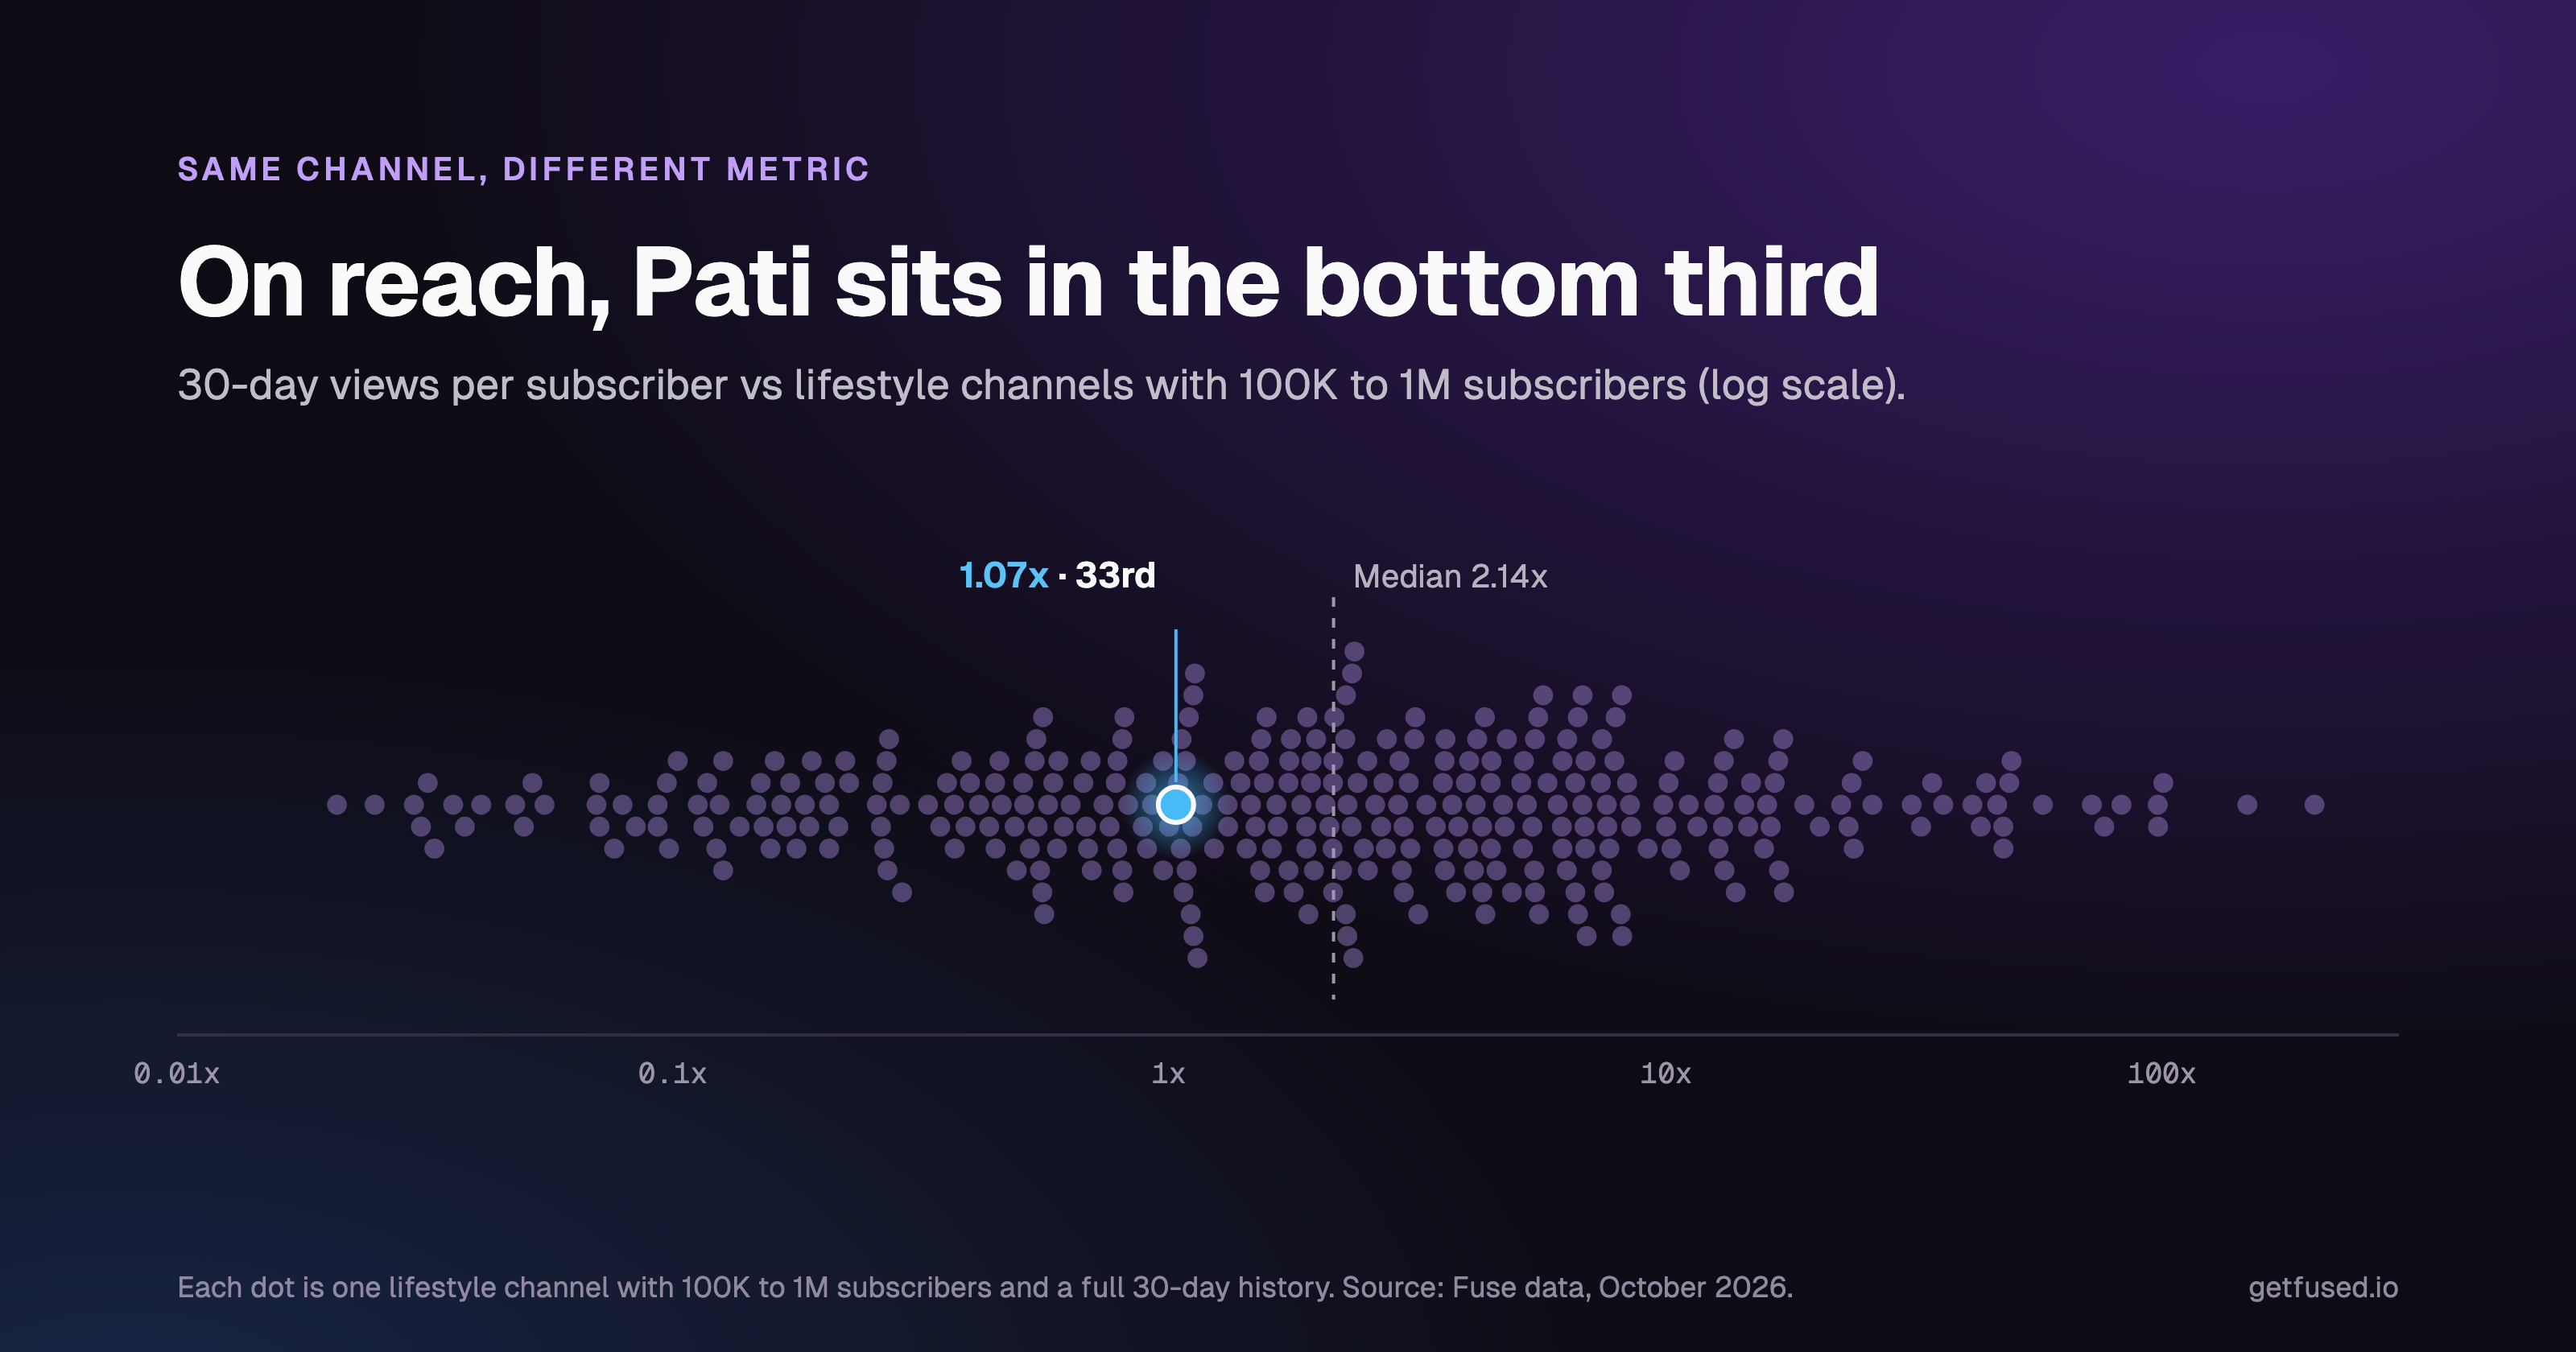
The views-per-subscriber reading is the other direction. At 1.07x she sits at the 33rd percentile. Her 133,000 subscribers generated 142,904 views over the last 30 days. The cohort median is 2.14x. The 33rd-percentile reading is a descriptive rank against 319 peers on this snapshot, not an attribution to any traffic source.
Cadence is at the 61st percentile: 8 videos in the last 30 days against a cohort median of 5. Shorts share is 7 percent of the last 30 videos, below the cohort median of 23 percent and sitting at the 29th percentile for the niche.
The shape is high engagement percentile, low views-per-subscriber percentile, cadence just above median, Shorts share below median. That is a reach-shaped read on public data, not a quality grade.
Compare this with the shape in the earlier benchmark post, where Erin Talks Money's finance macro read came in at p12 engagement, p98 views per subscriber, p95 cadence, p98 Shorts share. Opposite shape, same four-metric read. Different patterns suggest different tests to run, which is the subject of the "What should I do with the audit results?" section below.
How do I audit any YouTube channel for free?
Paste the handle into Fuse's channel benchmark tool. The tool reads the primary topic and the size bucket from Fuse's dataset, pulls the latest canonical aggregate for that cohort, and interpolates the channel's values against the stored percentile curves. The output is the four-row shape above with the cohort size next to it. No account, no card, no watermark on the result.
The manual Studio method is doable on a channel the reader owns. Pull the last 30 days of views and engagement from Studio, then look up 15 to 20 same-niche same-size peers one at a time at the channel-stats tool, sort by each metric, and read where the channel lands. Time estimate: about an hour per peer set. The output is the same percentile reading the free tool produces in three seconds.
If the channel is the reader's own, Fuse's AI channel audit at /audit is a signed-in version that pulls Studio-side data over OAuth and surfaces score breakdowns per metric. The four percentile audit above is the free, no-signup version and the entry point; the signed-in audit is a different depth. What Fuse Pro adds on top of the free audit covers private YouTube analytics, full outlier analysis, and competitor tracking up to 10 channels.
Which tools audit YouTube channels, and how do they compare?
These tools each expose some comparison. The table is what they actually filter and gate. Prices below are from each vendor's public pricing page on 2026-09-30 for Fuse, OutlierKit, and Viewstats; the others carry forward from the 2026-09-23 verification in the analytics tools roundup. Vendor plans change often, so check before you buy.
| Tool | Audit type | Niche + size filter | Signup? | Free tier? | Paid entry price | Notes |
|---|---|---|---|---|---|---|
| Fuse | Cohort (niche + size), four percentile metrics | Yes, four size bands and seven primary topics | No for the free audit | Yes, any public channel | Pro 12 dollars/mo | Nightly canonical aggregates. Pro adds private YouTube analytics over OAuth, full outlier analysis, and competitor tracking up to 10 channels. |
| YouTube Studio | Own channel only, absolute numbers | No | Yes, channel owner | Yes, always free | Free | No peer comparison. Studio is the input for a manual audit, not the audit itself. |
| vidIQ | Competitor pick (choose peers manually) | No, you pick the channels | Yes | Limited free | Boost 16.58 dollars/mo billed yearly | Competitor audit sits on the paid Boost tier. The Keyword and Daily Ideas features sit on top. |
| TubeBuddy | Competitor pick (Competitor Scorecard) | No | Yes | Limited free | Pro 12 dollars/mo | Competitor Scorecard is on Legend, 26.39 dollars/mo. Audit lives in Studio as a sidebar. |
| Viewstats | Competitor pick (channel comparison) | Partial | Yes | Limited free | Pro, price gated on pricing page (verified 2026-09-30) | Business tier is 249 dollars/mo. Channel comparison lives on Pro. |
| Social Blade | Category rank, no size filter | Niche only, no size | Not required for the public page | Yes, public page | 5 dollars/mo billed yearly | Ranks against the whole category, which pits a 50,000-sub channel against the 100,000,000-sub channels in the same niche. |
| OutlierKit | Outlier-focused, not a full audit | Niche only, no size filter | Yes | 30-credit trial | Hobby 16.60 dollars/mo billed annually | Reads breakouts across a niche, not a channel's whole shape. Useful as step 6 of the checklist above, not as the whole audit. |
For an audit on a channel the reader does not own, Fuse's free tier is the only entry in the table that produces a cohort-based four-metric read with no signup. Readers who already pay for vidIQ, TubeBuddy, or Viewstats can run the competitor-pick views on their own channel with peers chosen manually. Social Blade's public page is useful for a one-minute sanity check, but ranking a 100,000-sub lifestyle channel against 100,000,000-sub lifestyle channels does not reproduce the size-band read.
How often should I audit my channel?
Once a month, plus after any format or cadence change. The cohort medians move slowly between runs of Fuse's nightly aggregate (Fuse data, October 2026), so weekly audits mostly show noise. The FAQ below carries the three off-cycle moments.
What should I do with the audit results?
Pick the weakest percentile and the strongest, read both, then run one test tied to the weakest, and define the metric to re-measure next month. One test, not three.
The strongest metric is a signal to leave alone. If engagement is at the 85th percentile, that metric is not the constraint on this snapshot. The next test runs on the weakest percentile instead.
The weakest percentile is the constraint. Map it to the test worth running and to the metric that will tell you whether the test moved the number:
- Weakest is engagement rate: the test worth running is a format that invites a response per view (a question hook, a comment prompt in the first 60 seconds, or a naturally reactive format). Metric to watch next: engagement rate on the next 10 uploads vs the last 10.
- Weakest is views per subscriber: the test worth running is packaging on the existing top long-form videos. Titles and thumbnails, measured by 30-day views per subscriber next month.
- Weakest is upload cadence: the test is a cadence bump sustained for 30 days. Metric to watch: the cadence percentile and the views-per-subscriber percentile on the next re-audit.
- Weakest is Shorts share (too high): the test is pausing Shorts for 30 days. Metric to watch: the long-form median view count on the next re-audit. Reversible.
- Weakest is Shorts share (too low): the test is a 20 percent Shorts mix for 30 days on topics with breakout patterns on the long-form side. Metric to watch: the views-per-subscriber delta on the next re-audit.
- Weakest is breakouts (no 3x video in the last 60): the test is one topic adjacent to the strongest-performing video, shipped as a sibling. Metric to watch: the 3x threshold on the next 10 uploads.
- Weakest is growth: read growth direction on the channel itself. Do not compare to a cohort median this cycle (step 7 above). Metric to watch: the channel's own 30-day MoM on the next re-audit.
Ship one test, wait 30 days, re-audit. If the weakest percentile moved up, the test moved the number. If it did not, try a different lever. The audit ranks four metrics. It does not assign a grade. For a step-by-step guide to the breakout read in step 6, how to find YouTube outlier videos on any channel is the deeper companion.
For a full read of the percentile math behind the four metrics, the method notes on cohort calculations are on the methodology page.
Frequently asked questions
- What is a YouTube channel audit?
- A YouTube channel audit is a short read of a channel's engagement, reach, cadence, and Shorts mix measured against the median of peers in the same niche and size band, usually 100 to 500 channels. The output is a percentile per metric, not a single grade. Fuse computes the percentiles for any public channel from its nightly canonical aggregates (Fuse data, October 2026).
- How often should I audit my YouTube channel?
- Once a month, and after any format or cadence change. Weekly audits mostly show noise because Fuse's cohort medians move slowly between nightly aggregate runs (Fuse data, October 2026). Monthly catches shifts worth responding to: an engagement percentile that drops after a Shorts push, a cadence percentile that drops after a travel month, or a Shorts share percentile that moves after a format change.
- Can I audit a YouTube channel I don't own?
- Yes, on public data. Fuse computes the four percentile audit metrics for any public channel in its dataset, free, with no account at the channel benchmark tool. YouTube Studio only shows your own channel. vidIQ, TubeBuddy, Viewstats, and OutlierKit will each surface competitor comparisons, but they ask for a signup and gate the useful views behind a paid tier.
- What is a good engagement rate on YouTube in 2026?
- Depends on the niche and size. Lifestyle macro channels (100,000 to 1,000,000 subs) sit at a 2.80 percent median engagement rate; finance macro sits at 3.77 percent; technology micro at 2.20 percent (Fuse data, October 2026). A 3 percent rate is strong in tech and below median in finance. The generic 'engagement over 3 percent is good' rule is a finance-weighted average.
- How much does a YouTube channel audit cost?
- The four percentile audit for any public channel costs zero at Fuse, with no account. Fuse Pro is 12 dollars per month and adds the signed-in version with historical trend, score breakdowns per metric, full outlier analysis, and competitor tracking up to 10 channels. Paid audit services from consultants vary in price and sell an opinion on top of the same public data.
- Can YouTube Studio do a channel audit?
- No, not in the audit sense. Studio shows absolute numbers for your own channel: views, impressions, click-through rate, retention, traffic sources. It never says normal, strong, or weak for the niche and size. You can run the manual version by exporting Studio data for your channel plus 10 to 20 peers, computing medians, and reading percentiles by hand, which takes about an hour.
- What is the fastest way to audit a YouTube channel?
- Paste the handle into the free Fuse channel benchmark tool. It reads the primary topic and size bucket from Fuse's data, pulls last night's cohort aggregate, and interpolates four percentile metrics against the stored curves. The output takes about three seconds. The manual Studio method is doable but adds an hour per peer set.
- Do channel audits work for small channels?
- Yes, above 1,000 subs and 10 videos. Below that, the cohort math is thin and the Shorts versus long-form split too narrow to carry signal. Fuse marks any read against a cohort of fewer than 20 channels as low confidence. In most niches the nano and micro buckets have 100 or more channels, so a sub-10,000 channel still gets a usable read above the 1,000-sub floor.
- What does a YouTube channel audit measure?
- Four percentile metrics against niche-and-size peers: engagement rate (likes plus comments divided by views), views per subscriber over 30 days, upload cadence (videos published in the last 30 days), and Shorts share of the last 30 videos. Three secondary signals: the Shorts versus long-form view split, the top three breakout videos, and the growth direction with a wide confidence interval.
- Should I pay for a YouTube channel audit service?
- Not for a one-off read on public data. The four percentile metrics are free on any public channel at Fuse. A paid audit buys a consultant's opinion on top of the same public data, which is sometimes worth it for a format or packaging call. For ongoing reads with historical trend, score breakdowns, and competitor tracking, Fuse Pro is 12 dollars per month.
- Can the audit tell me if my titles and thumbnails are weak?
- Not directly. The audit tells you whether reach is weak, which is often a titles-and-thumbnails problem downstream. A low views-per-subscriber percentile with a high engagement percentile is the classic 'packaging is the lever' shape. The audit identifies the lever; the title and thumbnail test is the next experiment, run on your three top-performing videos as the template.
- What's the difference between a channel audit and a video audit?
- A channel audit reads the whole channel's performance against peers in the niche and size cohort. A video audit reads one video's retention, CTR, and audience data against the channel's own baseline. Both are useful at different moments: the channel audit tells you what to work on next, the video audit tells you why one upload beat another on the same channel.
Nick Julia
Written by Nick Julia.
Related reading
YouTube Analytics
How Does My YouTube Channel Compare to Similar Channels in My Niche?
Benchmark your YouTube channel against peers in the same niche and size band. The five metrics worth comparing, how percentiles work, and a real example.
October 5, 2026 · 12 min read
YouTube Analytics
Best YouTube Analytics Tools 2026: An Operator's Comparison
An operator's comparison of the six YouTube analytics tools worth using in 2026: Fuse, vidIQ, TubeBuddy, Social Blade, YouTube Studio, and Noxinfluencer.
September 24, 2026 · 9 min read
YouTube Analytics
How to Find Your YouTube Outlier Videos (Free, No Signup)
A YouTube outlier video earns 3x or more the channel's median views. Here is how to find yours on any channel, free, no signup, plus what to make next.
September 24, 2026 · 10 min read